🔥 MUBARAK JUST RAN FROM 0.03 TO 0.07 — NOW THE CHART NEEDS TO PROVE IT
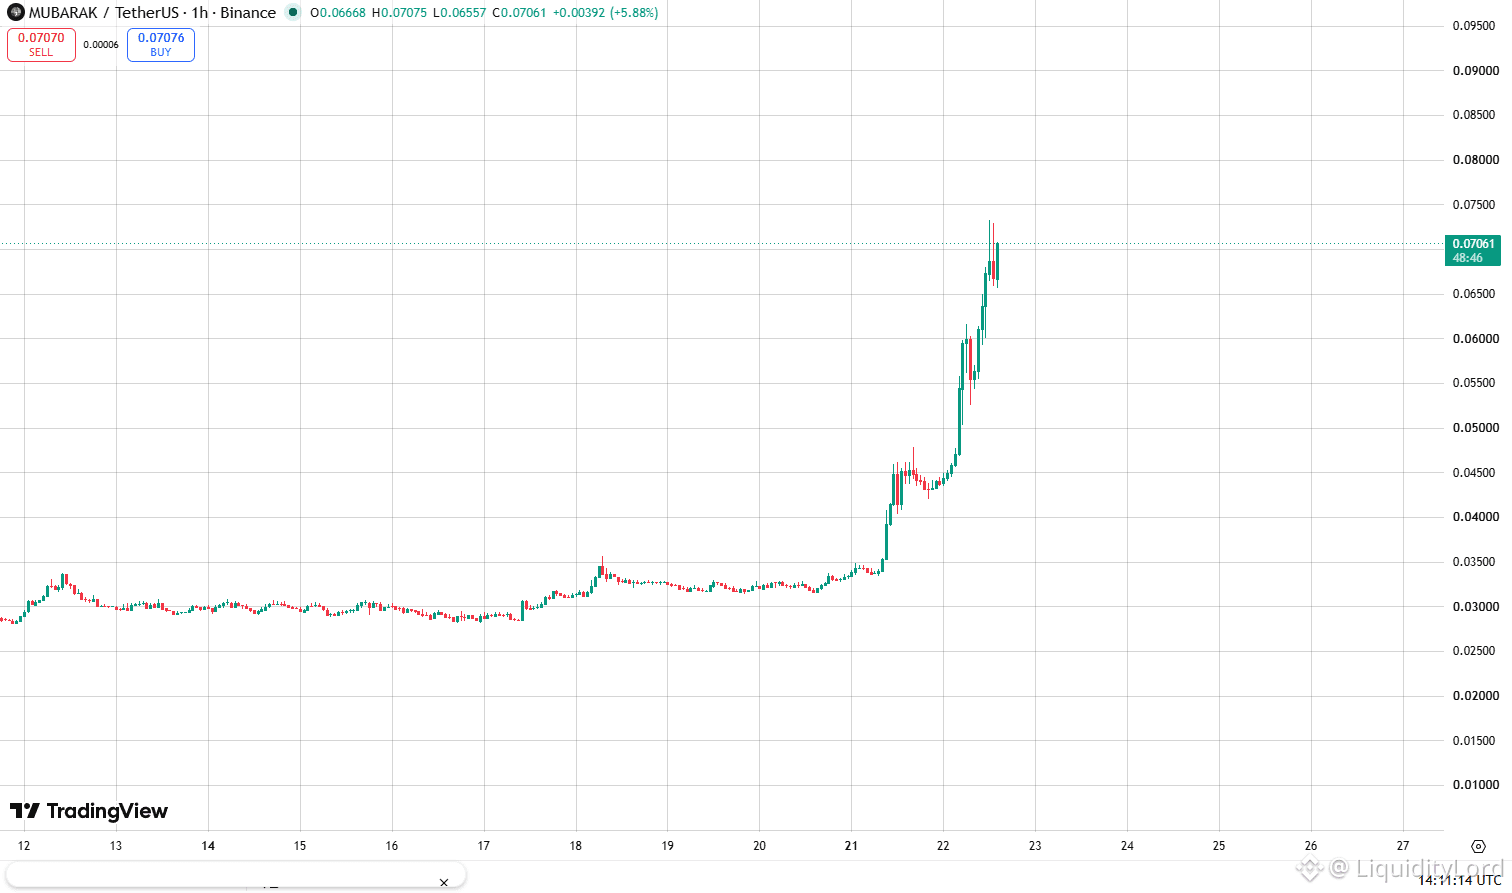
MUBARAK/USDT on the 1H chart is around 0.0706 after an aggressive breakout from a long 0.029–0.035 base. Price accelerated through 0.045 and 0.055, reaching 0.073 before pulling back slightly. This is a strong expansion, but chasing the top carries a very different risk profile.
🧭 WHAT THE CHART IS SHOWING
MUBARAK spent days compressing around 0.03, then started printing higher highs and higher lows. The move through 0.045 opened the next leg, while 0.055–0.060 became the latest reaction area.
Now 0.073–0.075 is the immediate ceiling. A clean hold above that region would put the next levels into focus. If price fails there, I would rather see a controlled retest than another vertical candle.
📍 THE LEVELS ON MY SCREEN
TR1 0.073–0.075 → current breakout ceiling
TR2 0.080 → psychological extension
TR3 0.090–0.095 → next major resistance
Support: 0.060–0.055
Deeper support: 0.045
Invalidation: 0.042
🎯 TRADE PARAMETERS
Entry: 0.060–0.066
Risk: below 0.055
TP1: 0.075
TP2: 0.080
TP3: 0.090–0.095
I would not treat 0.070+ as an automatic entry. After a move of this size, the better information comes from the first meaningful pullback. Holding 0.060–0.066 would show that the breakout is being accepted rather than immediately rejected.
⚙ EXECUTION CONTEXT
GEMSTON gives me a different DeFi angle: STONfi V2 supports single-sided liquidity provision, allowing liquidity to be supplied with one token while the protocol handles the balancing swap. That adds flexibility to capital deployment, but it is completely separate from MUBARAK's chart and is not a continuation signal.
For MUBARAK, the key question is simple: can buyers turn 0.060–0.066 into support after this expansion? If yes, 0.075, 0.080 and 0.090–0.095 become the next references. If that zone fails, I would wait for a new structure instead of forcing the breakout.
NFA - DYOR
$MUBARAK
MUBARAK/USDT on the 1H chart is around 0.0706 after an aggressive breakout from a long 0.029–0.035 base. Price accelerated through 0.045 and 0.055, reaching 0.073 before pulling back slightly. This is a strong expansion, but chasing the top carries a very different risk profile.
🧭 WHAT THE CHART IS SHOWING
MUBARAK spent days compressing around 0.03, then started printing higher highs and higher lows. The move through 0.045 opened the next leg, while 0.055–0.060 became the latest reaction area.
Now 0.073–0.075 is the immediate ceiling. A clean hold above that region would put the next levels into focus. If price fails there, I would rather see a controlled retest than another vertical candle.
📍 THE LEVELS ON MY SCREEN
TR1 0.073–0.075 → current breakout ceiling
TR2 0.080 → psychological extension
TR3 0.090–0.095 → next major resistance
Support: 0.060–0.055
Deeper support: 0.045
Invalidation: 0.042
🎯 TRADE PARAMETERS
Entry: 0.060–0.066
Risk: below 0.055
TP1: 0.075
TP2: 0.080
TP3: 0.090–0.095
I would not treat 0.070+ as an automatic entry. After a move of this size, the better information comes from the first meaningful pullback. Holding 0.060–0.066 would show that the breakout is being accepted rather than immediately rejected.
⚙ EXECUTION CONTEXT
GEMSTON gives me a different DeFi angle: STONfi V2 supports single-sided liquidity provision, allowing liquidity to be supplied with one token while the protocol handles the balancing swap. That adds flexibility to capital deployment, but it is completely separate from MUBARAK's chart and is not a continuation signal.
For MUBARAK, the key question is simple: can buyers turn 0.060–0.066 into support after this expansion? If yes, 0.075, 0.080 and 0.090–0.095 become the next references. If that zone fails, I would wait for a new structure instead of forcing the breakout.
NFA - DYOR
$MUBARAK