
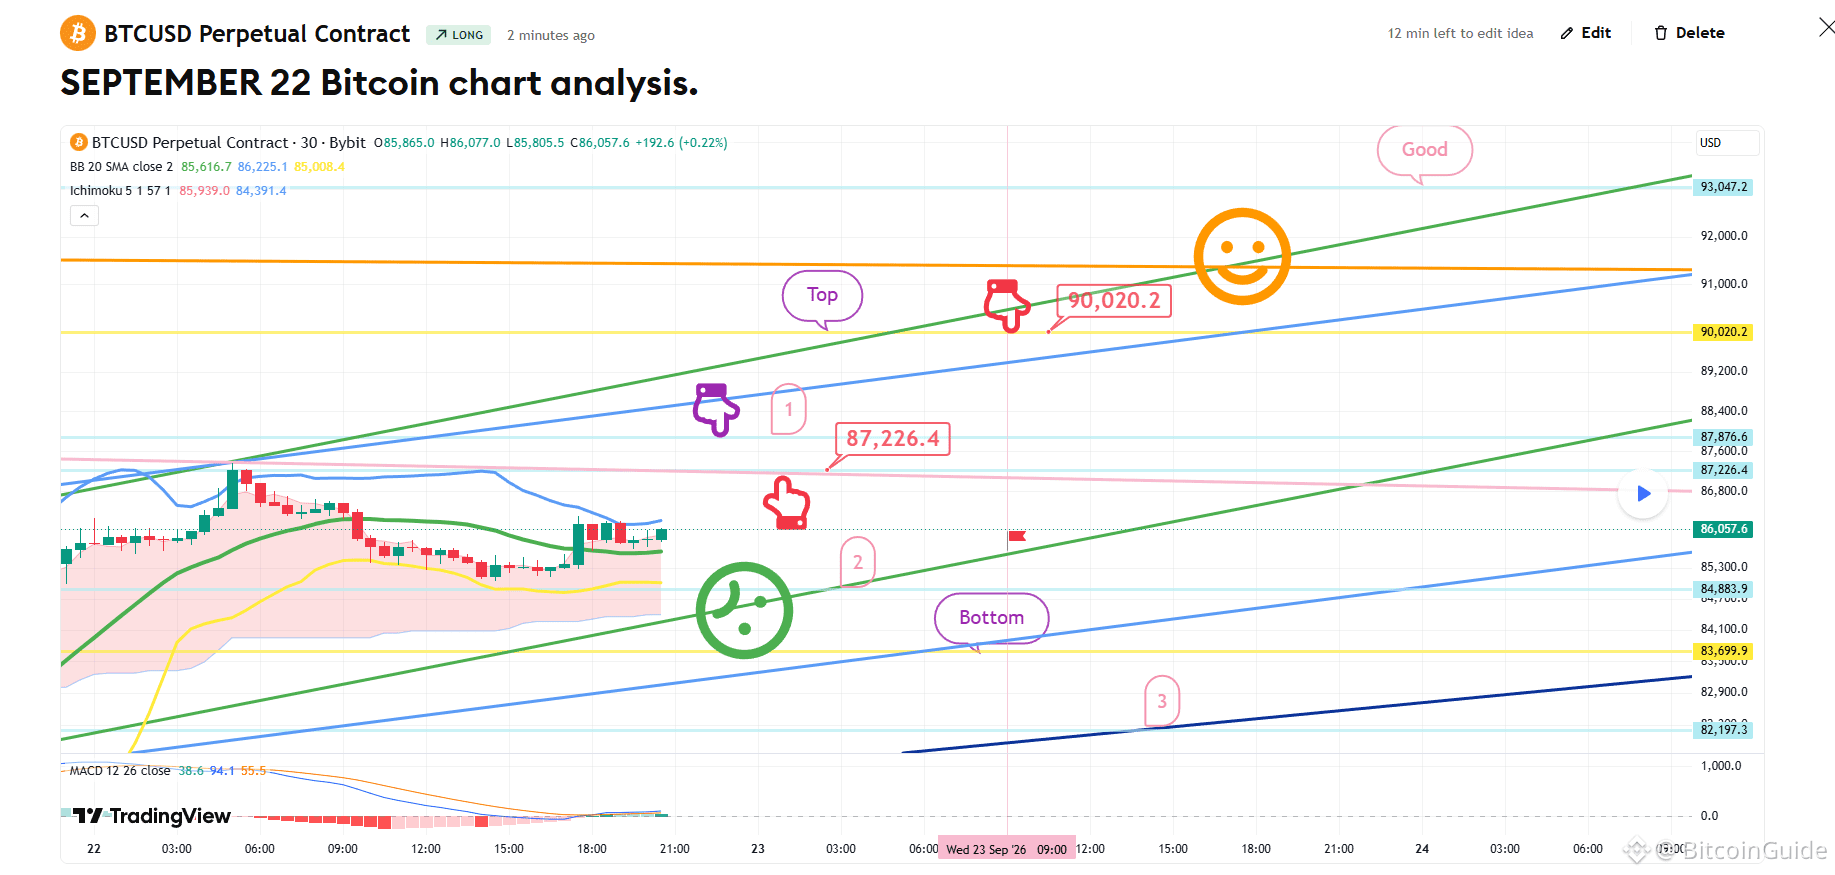
[September 22 Bitcoin chart analysis] BTCUSD 30Min Chart *My analysis is optimized for TradingView. If you press the replay button, you can check real-time movements. -Long position strategy- *The long position strategy focuses on the area marked by the purple finger (labeled "1")—specifically, the movements before and after touching it. 1) After confirming a touch at the purple finger zone (87,876.6 USD): Enter a long position at the red finger zone (87,226.4 USD); set the stop-loss level at the point where the green support line is breached. 2) Top zone (90,0020.2 USD) is the first target for the long position -> "Good" zone is the second target. 3) If the price drops immediately without touching the purple finger zone: The strategy is to wait for a long entry at the lower zone marked "2." Please be cautious: if the green support line is broken, the price could fall to the levels marked "Bottom" or even down to zone "3." I post the analysis results as a Comment every day. Thank you. (You can find the link on my profile.) - Click Follow to receive faster information every day. - Check the results using the replay button on TradingView. #Bitcoin #Crypto# #XRP #BTC100K $USDT $XRP $BTC $ETH

Đăng
Tuyên bố miễn trừ trách nhiệm: Nội dung bao gồm cả quan điểm của bên thứ ba, không phải lời khuyên. Có thể sử dụng nội dung do Binance Ai đưa ra nhưng không được đảm bảo. Xem Điều khoản & Điều kiện.