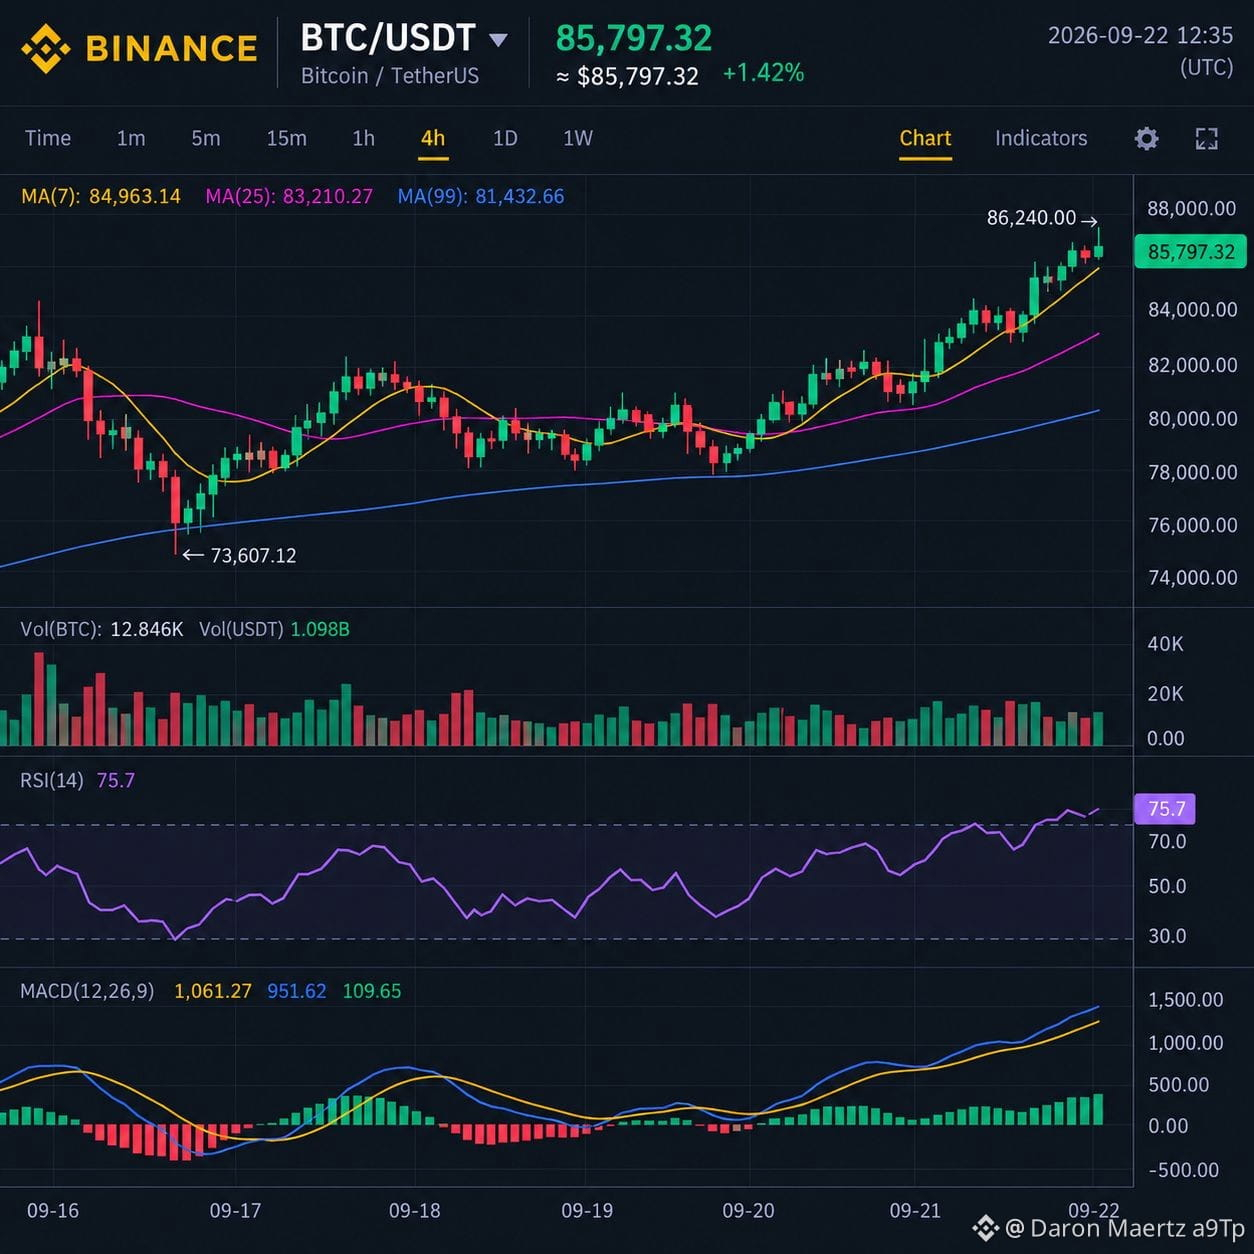
🚀BITCOIN TO THE MOON? $BTC 86,000 BREAKOUT + RSI & MACD ALIGNMENT! 🔥
Kia Crypto Winter Hamesha K Liye Khatam? Ya Yeh Aik Bull Trap Hai? 🤔
Dosto, Bitcoin ne pichle 8 mahino ki sab se oonchi satah (8-Month High) yaani $BTC 86,000 ki deewar ko tod diya hai! Is waqt market mein $648M se zyada ke shorts liquidate ho chuke hain. Lekin trade open karne se pehle chaliye dekhte hain indicators kia bol rahe hain:
📊 Technical Analysis (RSI & MACD Update):
RSI (Relative Strength Index): Daily chart par RSI is waqt 72-74 ke zone (Overbought) mein enter ho chuka hai. Yeh dikhata hai ke market mein buying momentum bohot strong hai, lekin sath hi sath aik short-term cooldown ya minor profit-taking correction bhi aa sakti hai
MACD (Moving Average Convergence Divergence): MACD line is waqt Signal line ke upar strong Bullish Crossover bana chuki hai. Iske sath hi histogram bars musalsal green ho rahe hain, jo yeh confirm karta hai ke buyers fully control mein hain aur trend abhi upar ki taraf momentum pakad raha hai.
📈 Key Levels to Watch:
Current Price: ~$85,600
Target/Resistance: Agla bara resistance target seedha $89,800 hai.
Support Zone: Pullback ki surat mein $81,200 aur $76,500 strong support ka kaam karenge.
💡 Expert Strategy:
Indicators se saaf zahir hai ke momentum bohot bullish hai lekin blind FOMO se bachein kyunki RSI overbought hai. Behtar strategy yeh hai ke direct top par buy karne ki jagah chote pullbacks ka wait kiya jaye aur hamesha Stop-Loss ke sath trade ki jaye!
👇 Aapka kia plan hai? Kya aap is level par long kar rahe hain ya short? Niche comments mein apna technical view share karein!
#BTC☀️ #RSI #MACD #BinanceSquare
$BTC
Kia Crypto Winter Hamesha K Liye Khatam? Ya Yeh Aik Bull Trap Hai? 🤔
Dosto, Bitcoin ne pichle 8 mahino ki sab se oonchi satah (8-Month High) yaani $BTC 86,000 ki deewar ko tod diya hai! Is waqt market mein $648M se zyada ke shorts liquidate ho chuke hain. Lekin trade open karne se pehle chaliye dekhte hain indicators kia bol rahe hain:
📊 Technical Analysis (RSI & MACD Update):
RSI (Relative Strength Index): Daily chart par RSI is waqt 72-74 ke zone (Overbought) mein enter ho chuka hai. Yeh dikhata hai ke market mein buying momentum bohot strong hai, lekin sath hi sath aik short-term cooldown ya minor profit-taking correction bhi aa sakti hai
MACD (Moving Average Convergence Divergence): MACD line is waqt Signal line ke upar strong Bullish Crossover bana chuki hai. Iske sath hi histogram bars musalsal green ho rahe hain, jo yeh confirm karta hai ke buyers fully control mein hain aur trend abhi upar ki taraf momentum pakad raha hai.
📈 Key Levels to Watch:
Current Price: ~$85,600
Target/Resistance: Agla bara resistance target seedha $89,800 hai.
Support Zone: Pullback ki surat mein $81,200 aur $76,500 strong support ka kaam karenge.
💡 Expert Strategy:
Indicators se saaf zahir hai ke momentum bohot bullish hai lekin blind FOMO se bachein kyunki RSI overbought hai. Behtar strategy yeh hai ke direct top par buy karne ki jagah chote pullbacks ka wait kiya jaye aur hamesha Stop-Loss ke sath trade ki jaye!
👇 Aapka kia plan hai? Kya aap is level par long kar rahe hain ya short? Niche comments mein apna technical view share karein!
#BTC☀️ #RSI #MACD #BinanceSquare
$BTC