
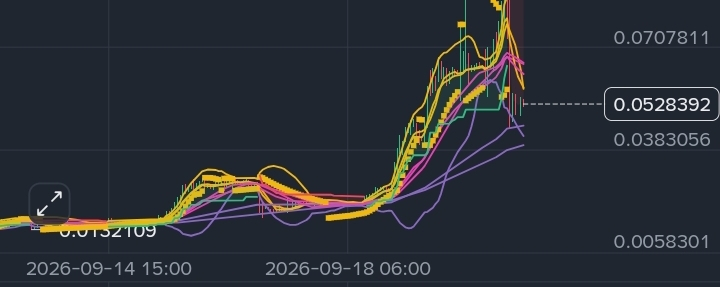

Akita Inu ($AKE) has experienced a sharp 15% intraday drop, pulling the price down to the $0.052 range. After a spectacular macro run-up from its summer accumulation phase, profit-taking has taken center stage.
The Technical Reality Check
Consolidation or Breakdown? On the 1-hour chart, AKE is fighting to establish a local floor. It is currently trading below its immediate exponential moving averages (EMA 7 & 25), pointing to strict overhead resistance near $0.057 - $0.062.
RSI Divergence: While the 1-hour RSI is sitting heavily at 34.7 (flirting with oversold levels), the 15-minute timeframe is flattening out near 53. This indicates that the intense selling pressure seen earlier today is beginning to exhaust itself into sideways consolidation.
Macro Perspective: Zooming out to the daily chart, this correction follows an aggressive macro move toward $0.160. A pullback of this scale is standard market behavior to flush out late leverage before establishing a healthy higher low.
Key Levels to Watch
Support Zone: $0.048 - $0.051. Bulls must hold this area on a 4-hour and daily closing basis to prevent a deeper slide down toward the $0.042 lower Bollinger Band support.
Resistance Levels: $0.057 (MA7) and $0.065 (MA25). Reclaiming these zones is a prerequisite for any renewed bullish continuation.
Market Outlook
AKE is in a high-volatility compression zone. High-risk scalpers are eyeing the current range for bounce plays due to the near-oversold hourly conditions, while conservative swing traders may prefer to wait for a confirmed trend-reversal pattern or a clean breakout back above $0.065.
Disclaimer: This content is for educational and informational purposes only. Crypto trading carries high risk. Always do your own research (DYOR).
#AKE #AkitaInu #Altcoins #CryptoAnalysis #BinanceSquare