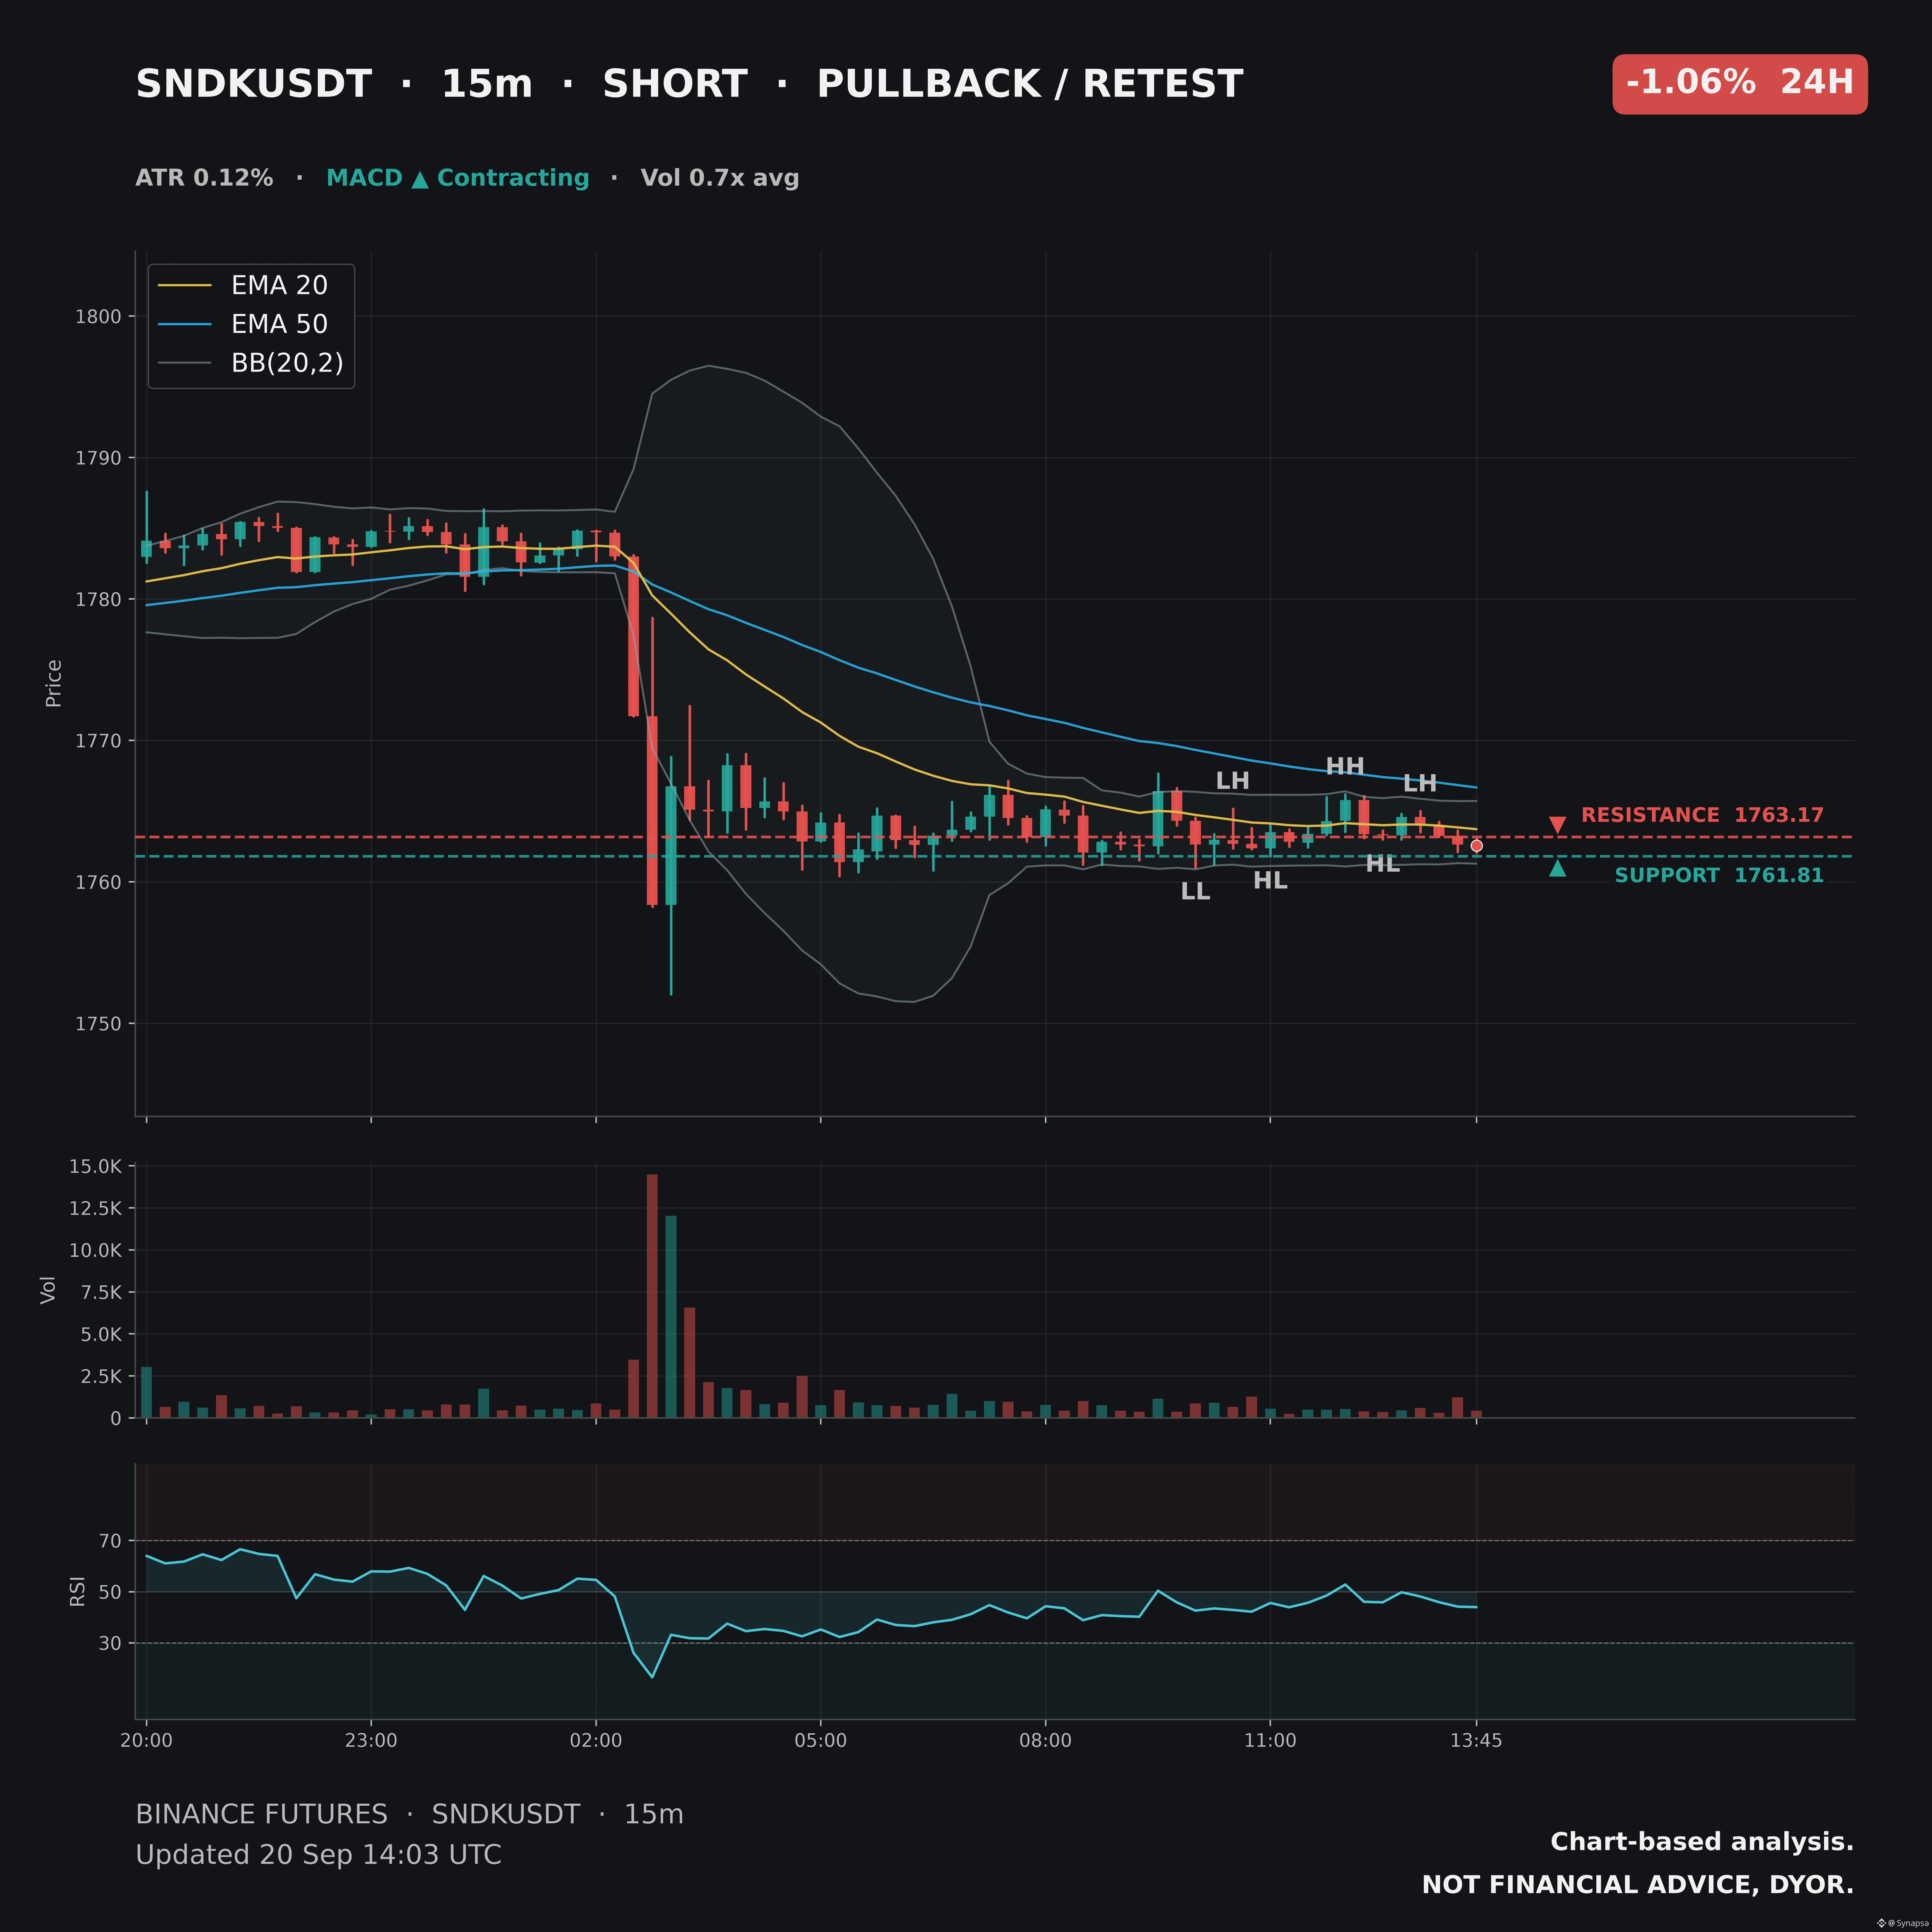
Sellers are starting to lean on $SNDK after that nasty run-up, and the 15m chart is showing a cleaner bearish push underneath the 1763 area. The short zone is 1762.57–1763.17, with SL 1764.75, then TP1 1760.39 and TP2 1758.65.
The interesting part is the timeframe clash: 15m is firmly bearish with falling OBV and RSI sitting below 50, while 1h and 4h are still carrying bullish structure. SNDK is also heavily extended from its longer-term average, so this looks more like a sharp pullback play inside a much larger move rather than a full trend flip.
The interesting part is the timeframe clash: 15m is firmly bearish with falling OBV and RSI sitting below 50, while 1h and 4h are still carrying bullish structure. SNDK is also heavily extended from its longer-term average, so this looks more like a sharp pullback play inside a much larger move rather than a full trend flip.