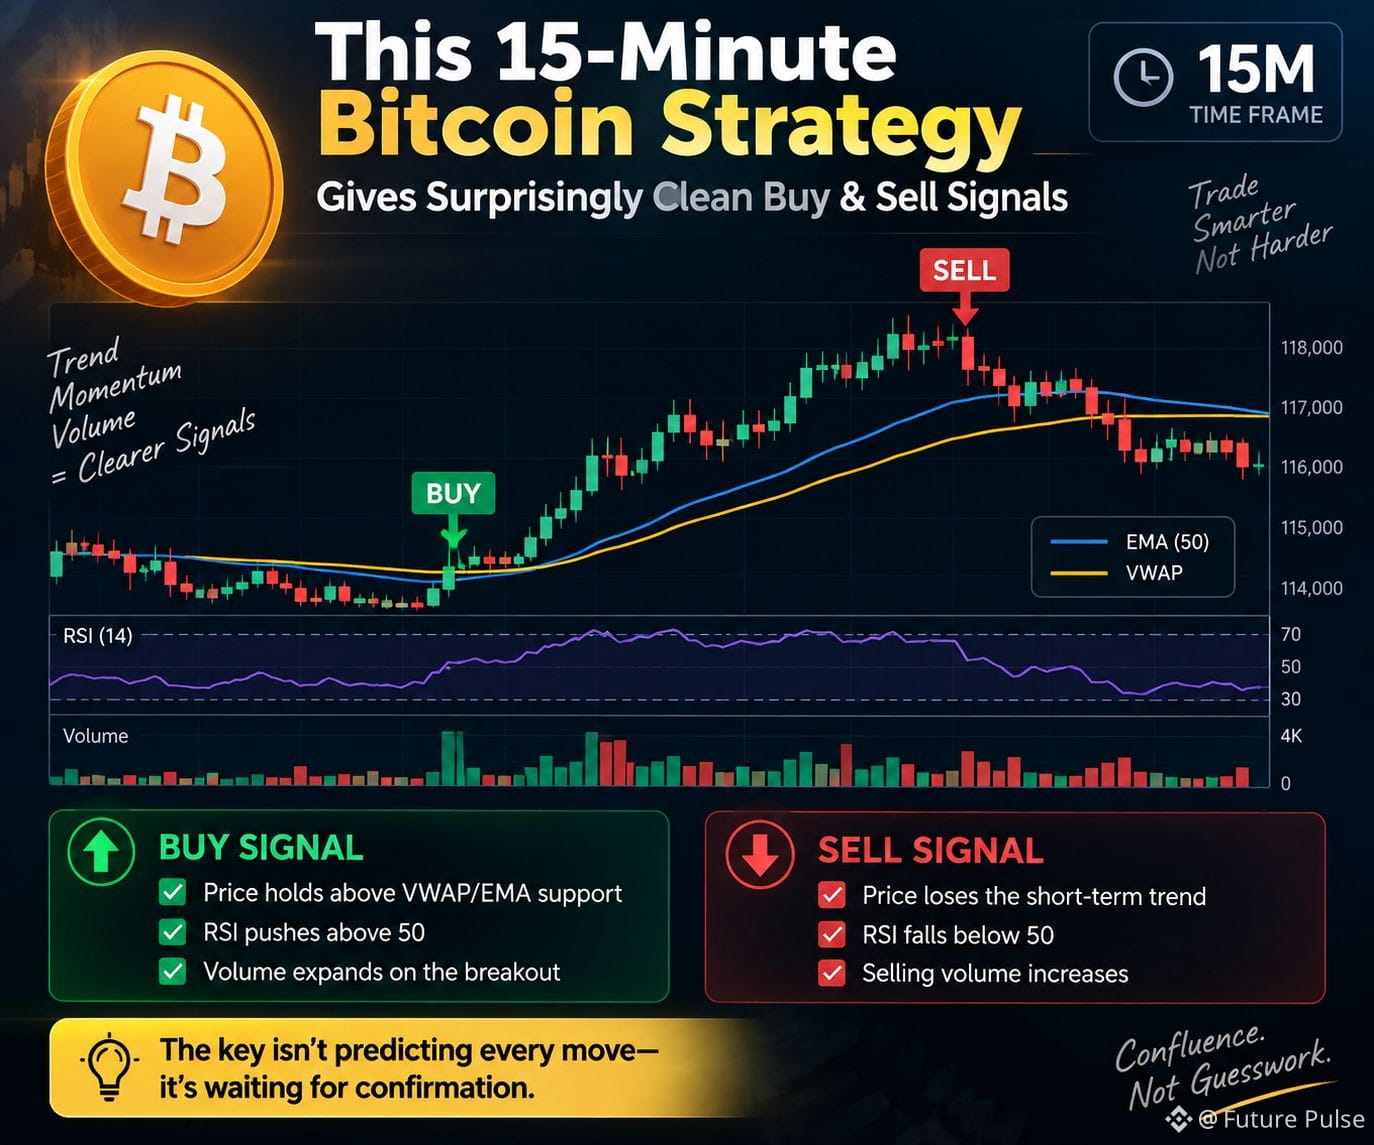

This 15-Minute Bitcoin Strategy Gives Surprisingly Clean Buy & Sell Signals 📊
I’ve been watching how the 15-minute BTC chart reacts when trend, momentum and volume align. The setup is simple:
🟢 Buy: Price holds above VWAP/EMA support, RSI pushes above 50, and volume expands on the breakout.
🔴 Sell: Price loses the short-term trend, RSI falls below 50, and selling volume increases.
The key isn’t predicting every move—it’s waiting for confirmation. In choppy markets, I’d rather miss a trade than force one.
For me, clean signals come from confluence, not a single indicator.
$SUI
$XRP
$BTC
📊 What confirms your Bitcoin trade on the 15-minute chart?
I’ve been watching how the 15-minute BTC chart reacts when trend, momentum and volume align. The setup is simple:
🟢 Buy: Price holds above VWAP/EMA support, RSI pushes above 50, and volume expands on the breakout.
🔴 Sell: Price loses the short-term trend, RSI falls below 50, and selling volume increases.
The key isn’t predicting every move—it’s waiting for confirmation. In choppy markets, I’d rather miss a trade than force one.
For me, clean signals come from confluence, not a single indicator.
$SUI
$XRP
$BTC
📊 What confirms your Bitcoin trade on the 15-minute chart?
🟢 EMA/VWAP support
📈 RSI momentum
📊 Volume breakout
🔥 All 3 together
17 giờ còn lại