

CFDs are complex instruments and come with a high risk of losing money rapidly due to leverage. 68% of retail investor accounts lose money when trading CFDs with this provider. You should consider whether you understand how CFDs work and whether you can afford to take the high risk of losing your money.
Individuals
StoneX Trading Logo
Apply for account
News and Analysis
Bitcoin Price Forecast: BTC/USD 42% Rally Puts Major Trend Reversal in Play
Bitcoin is surging toward a major technical showdown, with bulls now challenging the barrier that could unlock another powerful leg higher.
Written by
Michael Boutros
Michael Boutros
Sr. Technical Strategist
Fri, 18 Sept 2026, 09:26 PM
Add us as preferred source on Google
Share:
In this article
Bitcoin Technical Forecast: BTC/USD Weekly & Daily Trade Levels
Bitcoin Price Chart – BTC/USD Weekly
Bitcoin Price Chart – BTC/USD Daily
Bitcoin Technical Forecast: BTC/USD Weekly & Daily Trade Levels
Bitcoin has rallied more than 42% from the yearly low, with the August breakout extending into a major resistance confluence.
BTC/USD is poised to mark an outside-weekly reversal as buyers press the upper end of the September range.
A sustained break higher would strengthen the case for a larger trend reversal and expose yearly open resistance.
Failure to clear the current barrier would leave Bitcoin vulnerable to a deeper pullback within the broader recovery.
The weekly close should provide important confirmation on whether the latest surge can develop into a more durable advance.
Bitcoin has staged a dramatic recovery from the yearly lows, with the advance carrying BTC/USD back toward one of the most important resistance zones on the chart. The advance was further supported by improving regulatory sentiment after the SEC unveiled a new framework for tokenized securities, with the combination of fresh demand and short-covering helping accelerate the breakout above $80K. Today’s 5% surge has materially improved the near-term technical outlook, but a break above key resistance is still needed to validate a more significant trend reversal. With the weekly close approaching, the next reaction could prove critical in determining whether the recovery extends or begins to lose momentum. Battle lines drawn on the BTC/USD technical charts.
Bitcoin Price Chart – BTC/USD Weekly
image-20260918122249-3
Chart Prepared by Michael Boutros, Sr. Technical Strategist; BTC/USD on TradingView
In last month’s Bitcoin Forecast we noted that BTC/USD had broken the August range and, “the immediate focus is on whether the bulls can stabilize the breakout. From a trading standpoint, losses would need to be limited to 65,416 IF price is heading higher on this stretch with a close above 71,402 needed to fuel the next major leg of the rally.” Bitcoin surged more than 32% off the August low (42% off the yearly low) with the rally exhausting into the September open at 82,193-83,916. This region is defined by the May high-week close (HWC), the 2025 low-week close (LWC) and the 38.2% retracement of the decline off the record high. Note that the median-line of the 2025 pitchfork converges on this pivotal threshold over the next few weeks and a breach / weekly close above would be needed to validate a larger trend reversal is underway.
Bitcoin Price Chart – BTC/USD Daily image-20260918122309-4
Chart Prepared by Michael Boutros, Sr. Technical Strategist; BTC/USD on TradingView
A closer look at the Bitcoin daily chart shows the September range just below near-term resistance at the May high-day close (HDC) / high close at 81,447-82,193. Note that the February trendline converges on this zone over the next few days and a breach above this slope exposes key resistance at 83,712/916. Look for a larger reaction there IF reached with a daily / weekly close above needed to fuel the next major leg off the advance. Subsequent resistance objectives are eyed at the 2026 yearly open at 87,496 backed by the May low, the 2025 yearly open, and the 2026 HWC at 93,347/636.
Look for initial support at the monthly open near 78,571 with near-term bullish invalidation steady at the 2025 low / low-close at 74,434-76,159. Losses below this zone would validate a break of the September opening range, suggesting a more significant high is in place and raising the risk of a deeper correction. Subsequent support objectives rest with the 200-day moving average and the February low-day / low-week closes at 70,283/531 and the 61.8% retracement of the advance off the yearly low at 67,111.
Bottom line: Bitcoin is now poised to mark an outside weekly reversal with the bulls approaching major resistance hurdles just higher. From a trading standpoint, losses would need to be limited to 76,159 IF price is heading higher on this stretch with a close above 83,916 ultimately needed to mark resumption of the multi-month uptrend. Stay nimble here and watch the weekly closes for guidance.
--- Written by Michael Boutros, Senior Technical Strategist
Follow Michael on X @MBForex
Related tags:
Bitcoin
BTCUSD
Crypto Weekly Outlook
Cryptocurrencies
Technical Analysis
Michael Boutros
Latest market news
Crypto Technical Analysis: Bullish Momentum Pushes Cryptocurrencies to New Highs
Julian Pineda
Julian Pineda
Sun, 20 Sept 2026, 13:00
Cryptocurrencies
Crypto Weekly Outlook
+5
Crypto Technical Analysis: Bullish Momentum Pushes Cryptocurrencies to New Highs
Stocks Rally After the Rate Hike but is a Lagging Nasdaq Saying Something?
Stocks Rally After the Rate Hike but is a Lagging Nasdaq Saying Something?
Sun, 20 Sept 2026, 08:00
Crypto Fundamental Analysis: Better Regulatory Prospects Boost Crypto Sentiment
Crypto Fundamental Analysis: Better Regulatory Prospects Boost Crypto Sentiment
Sat, 19 Sept 2026, 17:00
USD/JPY weekly forecast: Suspected rate check revives intervention threat
USD/JPY weekly forecast: Suspected rate check revives intervention threat
Sat, 19 Sept 2026, 12:00
USD/JPY Analysis: Is the Yen Still Weak Despite the BOJ Rate Hike?
USD/JPY Analysis: Is the Yen Still Weak Despite the BOJ Rate Hike?
Sat, 19 Sept 2026, 02:11
USD Price Action Setups: USD/JPY, EUR/USD
USD Price Action Setups: USD/JPY, EUR/USD
Fri, 18 Sept 2026, 22:27
Bitcoin Price Forecast: BTC/USD 42% Rally Puts Major Trend Reversal in Play
Bitcoin Price Forecast: BTC/USD 42% Rally Puts Major Trend Reversal in Play
Fri, 18 Sept 2026, 21:26
US dollar forecast: USD/JPY surged on BoJ while Crude Oil rebounds to boost USD
US dollar forecast: USD/JPY surged on BoJ while Crude Oil rebounds to boost USD
Fri, 18 Sept 2026, 20:09
Nasdaq 100 Forecast: NDX extends gains as oil, Treasury yields fall
Nasdaq 100 Forecast: NDX extends gains as oil, Treasury yields fall
Fri, 18 Sept 2026, 16:45
BOJ split vote fuels yen weakness and Nikkei gains
BOJ split vote fuels yen weakness and Nikkei gains
Fri, 18 Sept 2026, 08:47
ASX 200 Rebounds, But Resistance Looms
ASX 200 Rebounds, But Resistance Looms
Fri, 18 Sept 2026, 05:05
USD/CAD forecast: Breakout gathers pace as US rates take over
USD/CAD forecast: Breakout gathers pace as US rates take over
Fri, 18 Sept 2026, 04:12
Web Trader platform
Our sophisticated web-based platform is packed with features.
Learn more
Open an account today
Experience award-winning platforms with fast and secure execution.
Open account
Economic calendar
Economic calendar
Related articles
Bitcoin Forecast: BTC/USD Back to $80K Ahead of Warsh’s Jackson Hole Speech
After surging over $15,000 in the past 10 days alone, there is risk of a near-term pullback if Warsh says anything remotely hawkish at Jackson Hole - what are the levels to watch from here?
Matt Weller
Matt Weller
Thu, 27 Aug 2026, 10:43 PM
Bitcoin
FOMC
Fed
+2
Euro Forecast: Will Core PCE Tip the Scales for the Fed?
The last Core PCE before the Fed's September meeting will mark 65 straight months above the central bank's 2% target - will it be enough to push the FOMC toward a rate hike?
Matt Weller
Matt Weller
Wed, 26 Aug 2026, 12:07 AM
Forex
Technical Analysis
+5
EUR/USD forecast: Technical Tuesday | August 25, 2026
The relative calm in the energy and bond markets have allowed the US dollar and equities to make a slightly positive start to the week. America’s economic war on Iran also failed to trigger any panic, leaving investors with little to chew over until the release of US inflation data on Wednesday and Kevin Warsh’s speech at the Jackson Hole Symposium on Friday.
Fawad Razaqzada
Fawad Razaqzada
Tue, 25 Aug 2026, 03:34 PM
EUR USD
Technical Analysis
+2
Tell me more about
Free live demo account
Trading platforms
Trading costs
Margin requirements
Terms and policies
I would like to
Fund my account
Withdraw funds
Download TradingView
Download MT4
Download mobile app
I would like to learn about
Spread betting
CFD trading
Managing risk
Client wellbeing
Contact us
StoneX Trading Logo - Inline White
Partnerships
StoneX
Affiliates
Investor relations
Press releases
CFDs are complex instruments and come with a high risk of losing money rapidly due to leverage. 68% of retail investor accounts lose money when trading CFDs with this provider. You should consider whether you understand how CFDs work and whether you can afford to take the high risk of losing your money.
StoneX Financial Ltd (trading as “StoneX Trading”) is an execution-only service provider. This material, whether or not it states any opinions, is for general information purposes only and it does not take into account your personal circumstances or objectives. This material has been prepared using the thoughts and opinions of the author and these may change. However, StoneX Trading does not plan to provide further updates to any material once published and it is not under any obligation to keep this material up to date. This material is short term in nature and may only relate to facts and circumstances existing at a specific time or day. Nothing in this material is (or should be considered to be) financial, investment, legal, tax or other advice and no reliance should be placed on it.
No opinion given in this material constitutes a recommendation by StoneX Trading or the author that any particular investment, security, transaction or investment strategy is suitable for any specific person. The material has not been prepared in accordance with legal requirements designed to promote the independence of investment research. Although StoneX Trading is not specifically prevented from dealing before providing this material, StoneX Trading does not seek to take advantage of the material prior to its dissemination. This material is not intended for disCFDs are complex instruments and come with a high risk of losing money rapidly due to leverage. 68% of retail investor accounts lose money when trading CFDs with this provider. You should consider whether you understand how CFDs work and whether you can afford to take the high risk of losing your money.
Individuals
StoneX Trading Logo
Apply for account
News and Analysis
Bitcoin Price Forecast: BTC/USD 42% Rally Puts Major Trend Reversal in Play
Bitcoin is surging toward a major technical showdown, with bulls now challenging the barrier that could unlock another powerful leg higher.
Written by
Michael Boutros
Michael Boutros
Sr. Technical Strategist
Fri, 18 Sept 2026, 09:26 PM
Add us as preferred source on Google
Share:
In this article
Bitcoin Technical Forecast: BTC/USD Weekly & Daily Trade Levels
Bitcoin Price Chart – BTC/USD Weekly
Bitcoin Price Chart – BTC/USD Daily
Bitcoin Technical Forecast: BTC/USD Weekly & Daily Trade Levels
Bitcoin has rallied more than 42% from the yearly low, with the August breakout extending into a major resistance confluence.
BTC/USD is poised to mark an outside-weekly reversal as buyers press the upper end of the September range.
A sustained break higher would strengthen the case for a larger trend reversal and expose yearly open resistance.
Failure to clear the current barrier would leave Bitcoin vulnerable to a deeper pullback within the broader recovery.
The weekly close should provide important confirmation on whether the latest surge can develop into a more durable advance.
Bitcoin has staged a dramatic recovery from the yearly lows, with the advance carrying BTC/USD back toward one of the most important resistance zones on the chart. The advance was further supported by improving regulatory sentiment after the SEC unveiled a new framework for tokenized securities, with the combination of fresh demand and short-covering helping accelerate the breakout above $80K. Today’s 5% surge has materially improved the near-term technical outlook, but a break above key resistance is still needed to validate a more significant trend reversal. With the weekly close approaching, the next reaction could prove critical in determining whether the recovery extends or begins to lose momentum. Battle lines drawn on the BTC/USD technical charts.
Bitcoin Price Chart – BTC/USD Weekly
image-20260918122249-3
Chart Prepared by Michael Boutros, Sr. Technical Strategist; BTC/USD on TradingView
In last month’s Bitcoin Forecast we noted that BTC/USD had broken the August range and, “the immediate focus is on whether the bulls can stabilize the breakout. From a trading standpoint, losses would need to be limited to 65,416 IF price is heading higher on this stretch with a close above 71,402 needed to fuel the next major leg of the rally.” Bitcoin surged more than 32% off the August low (42% off the yearly low) with the rally exhausting into the September open at 82,193-83,916. This region is defined by the May high-week close (HWC), the 2025 low-week close (LWC) and the 38.2% retracement of the decline off the record high. Note that the median-line of the 2025 pitchfork converges on this pivotal threshold over the next few weeks and a breach / weekly close above would be needed to validate a larger trend reversal is underway.
Bitcoin Price Chart – BTC/USD Daily image-20260918122309-4
Chart Prepared by Michael Boutros, Sr. Technical Strategist; BTC/USD on TradingView
A closer look at the Bitcoin daily chart shows the September range just below near-term resistance at the May high-day close (HDC) / high close at 81,447-82,193. Note that the February trendline converges on this zone over the next few days and a breach above this slope exposes key resistance at 83,712/916. Look for a larger reaction there IF reached with a daily / weekly close above needed to fuel the next major leg off the advance. Subsequent resistance objectives are eyed at the 2026 yearly open at 87,496 backed by the May low, the 2025 yearly open, and the 2026 HWC at 93,347/636.
Look for initial support at the monthly open near 78,571 with near-term bullish invalidation steady at the 2025 low / low-close at 74,434-76,159. Losses below this zone would validate a break of the September opening range, suggesting a more significant high is in place and raising the risk of a deeper correction. Subsequent support objectives rest with the 200-day moving average and the February low-day / low-week closes at 70,283/531 and the 61.8% retracement of the advance off the yearly low at 67,111.
Bottom line: Bitcoin is now poised to mark an outside weekly reversal with the bulls approaching major resistance hurdles just higher. From a trading standpoint, losses would need to be limited to 76,159 IF price is heading higher on this stretch with a close above 83,916 ultimately needed to mark resumption of the multi-month uptrend. Stay nimble here and watch the weekly closes for guidance.
--- Written by Michael Boutros, Senior Technical Strategist
Follow Michael on X @MBForex
Related tags:
Bitcoin
BTCUSD
Crypto Weekly Outlook
Cryptocurrencies
Technical Analysis
Michael Boutros
Latest market news
Crypto Technical Analysis: Bullish Momentum Pushes Cryptocurrencies to New Highs
Julian Pineda
Julian Pineda
Sun, 20 Sept 2026, 13:00
Cryptocurrencies
Crypto Weekly Outlook
+5
Crypto Technical Analysis: Bullish Momentum Pushes Cryptocurrencies to New Highs
Stocks Rally After the Rate Hike but is a Lagging Nasdaq Saying Something?
Stocks Rally After the Rate Hike but is a Lagging Nasdaq Saying Something?
Sun, 20 Sept 2026, 08:00
Crypto Fundamental Analysis: Better Regulatory Prospects Boost Crypto Sentiment
Crypto Fundamental Analysis: Better Regulatory Prospects Boost Crypto Sentiment
Sat, 19 Sept 2026, 17:00
USD/JPY weekly forecast: Suspected rate check revives intervention threat
USD/JPY weekly forecast: Suspected rate check revives intervention threat
Sat, 19 Sept 2026, 12:00
USD/JPY Analysis: Is the Yen Still Weak Despite the BOJ Rate Hike?
USD/JPY Analysis: Is the Yen Still Weak Despite the BOJ Rate Hike?
Sat, 19 Sept 2026, 02:11
USD Price Action Setups: USD/JPY, EUR/USD
USD Price Action Setups: USD/JPY, EUR/USD
Fri, 18 Sept 2026, 22:27
Bitcoin Price Forecast: BTC/USD 42% Rally Puts Major Trend Reversal in Play
Bitcoin Price Forecast: BTC/USD 42% Rally Puts Major Trend Reversal in Play
Fri, 18 Sept 2026, 21:26
US dollar forecast: USD/JPY surged on BoJ while Crude Oil rebounds to boost USD
US dollar forecast: USD/JPY surged on BoJ while Crude Oil rebounds to boost USD
Fri, 18 Sept 2026, 20:09
Nasdaq 100 Forecast: NDX extends gains as oil, Treasury yields fall
Nasdaq 100 Forecast: NDX extends gains as oil, Treasury yields fall
Fri, 18 Sept 2026, 16:45
BOJ split vote fuels yen weakness and Nikkei gains
BOJ split vote fuels yen weakness and Nikkei gains
Fri, 18 Sept 2026, 08:47
ASX 200 Rebounds, But Resistance Looms
ASX 200 Rebounds, But Resistance Looms
Fri, 18 Sept 2026, 05:05
USD/CAD forecast: Breakout gathers pace as US rates take over
USD/CAD forecast: Breakout gathers pace as US rates take over
Fri, 18 Sept 2026, 04:12
Web Trader platform
Our sophisticated web-based platform is packed with features.
Learn more
Open an account today
Experience award-winning platforms with fast and secure execution.
Open account
Economic calendar
Economic calendar
Related articles
Bitcoin Forecast: BTC/USD Back to $80K Ahead of Warsh’s Jackson Hole Speech
After surging over $15,000 in the past 10 days alone, there is risk of a near-term pullback if Warsh says anything remotely hawkish at Jackson Hole - what are the levels to watch from here?
Matt Weller
Matt Weller
Thu, 27 Aug 2026, 10:43 PM
Bitcoin
FOMC
Fed
+2
Euro Forecast: Will Core PCE Tip the Scales for the Fed?
The last Core PCE before the Fed's September meeting will mark 65 straight months above the central bank's 2% target - will it be enough to push the FOMC toward a rate hike?
Matt Weller
Matt Weller
Wed, 26 Aug 2026, 12:07 AM
Forex
Technical Analysis
+5
EUR/USD forecast: Technical Tuesday | August 25, 2026
The relative calm in the energy and bond markets have allowed the US dollar and equities to make a slightly positive start to the week. America’s economic war on Iran also failed to trigger any panic, leaving investors with little to chew over until the release of US inflation data on Wednesday and Kevin Warsh’s speech at the Jackson Hole Symposium on Friday.
Fawad Razaqzada
Fawad Razaqzada
Tue, 25 Aug 2026, 03:34 PM
EUR USD
Technical Analysis
+2
Tell me more about
Free live demo account
Trading platforms
Trading costs
Margin requirements
Terms and policies
I would like to
Fund my account
Withdraw funds
Download TradingView
Download MT4
Download mobile app
I would like to learn about
Spread betting
CFD trading
Managing risk
Client wellbeing
Contact us
StoneX Trading Logo - Inline White
Partnerships
StoneX
Affiliates
Investor relations
Press releases
CFDs are complex instruments and come with a high risk of losing money rapidly due to leverage. 68% of retail investor accounts lose money when trading CFDs with this provider. You should consider whether you understand how CFDs work and whether you can afford to take the high risk of losing your money.
StoneX Financial Ltd (trading as “StoneX Trading”) is an execution-only service provider. This material, whether or not it states any opinions, is for general information purposes only and it does not take into account your personal circumstances or objectives. This material has been prepared using the thoughts and opinions of the author and these may change. However, StoneX Trading does not plan to provide further updates to any material once published and it is not under any obligation to keep this material up to date. This material is short term in nature and may only relate to facts and circumstances existing at a specific time or day. Nothing in this material is (or should be considered to be) financial, investment, legal, tax or other advice and no reliance should be placed on it.
No opinion given in this material constitutes a recommendation by StoneX Trading or the author that any particular investment, security, transaction or investment strategy is suitable for any specific person. The material has not been prepared in accordance with legal requirements designed to promote the independence of investment research. Although StoneX Trading is not specifically prevented from dealing before providing this material, StoneX Trading does not seek to take advantage of the material prior to its dissemination. This material is not intended B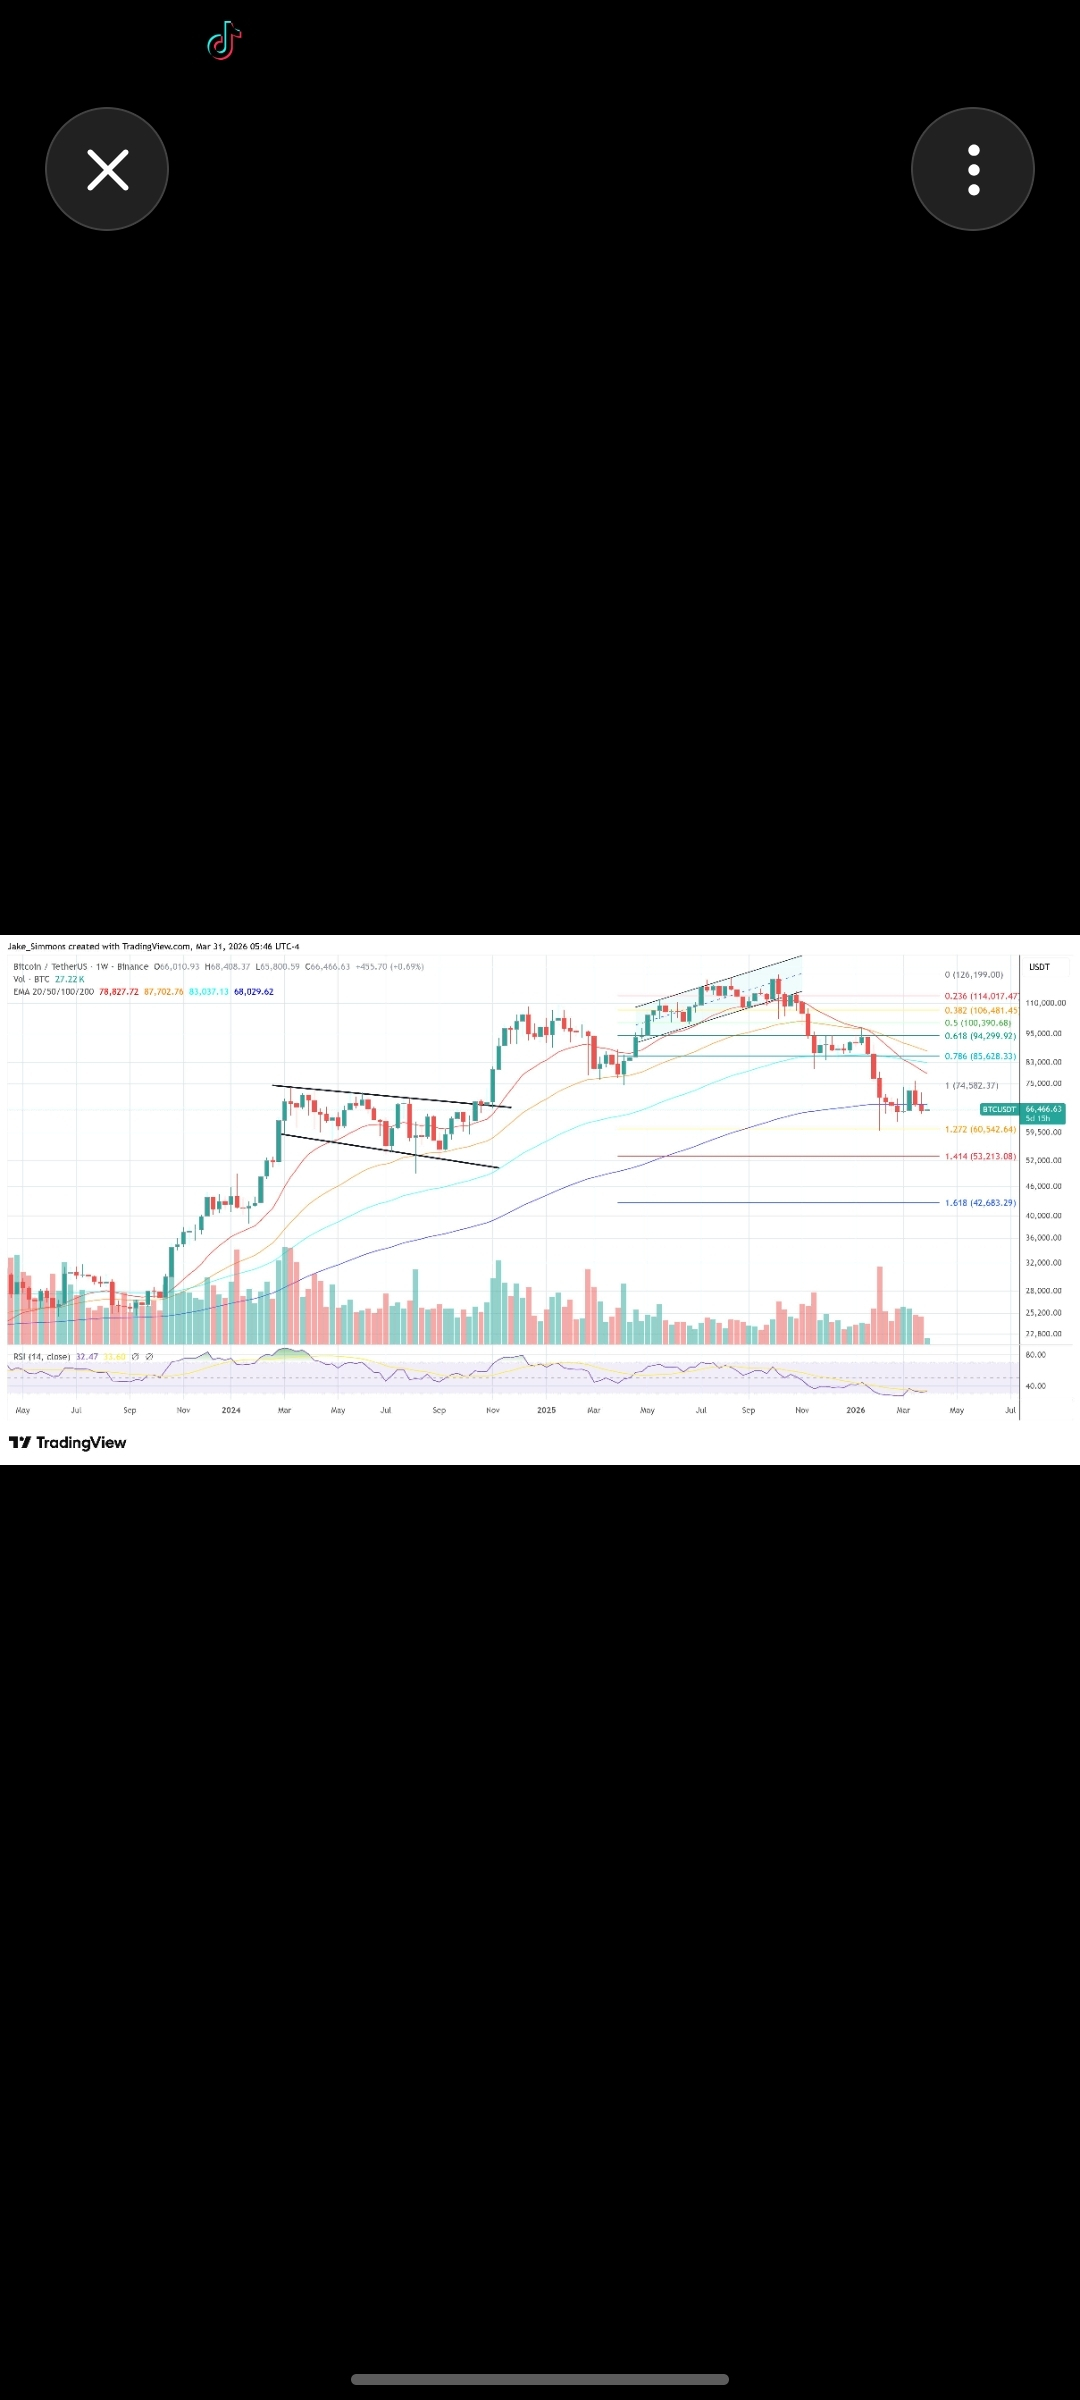 tribution to, or use by, any person in any country or jurisdiction where such distribution or use would be contrary to local law or regulation.
© StoneX Trading 2026
Terms and policies
tribution to, or use by, any person in any country or jurisdiction where such distribution or use would be contrary to local law or regulation.
© StoneX Trading 2026
Terms and policies