#cryptotradingpro #BTC
🚀 $BTC /USD Market Overview: Where will the price go next? 📊
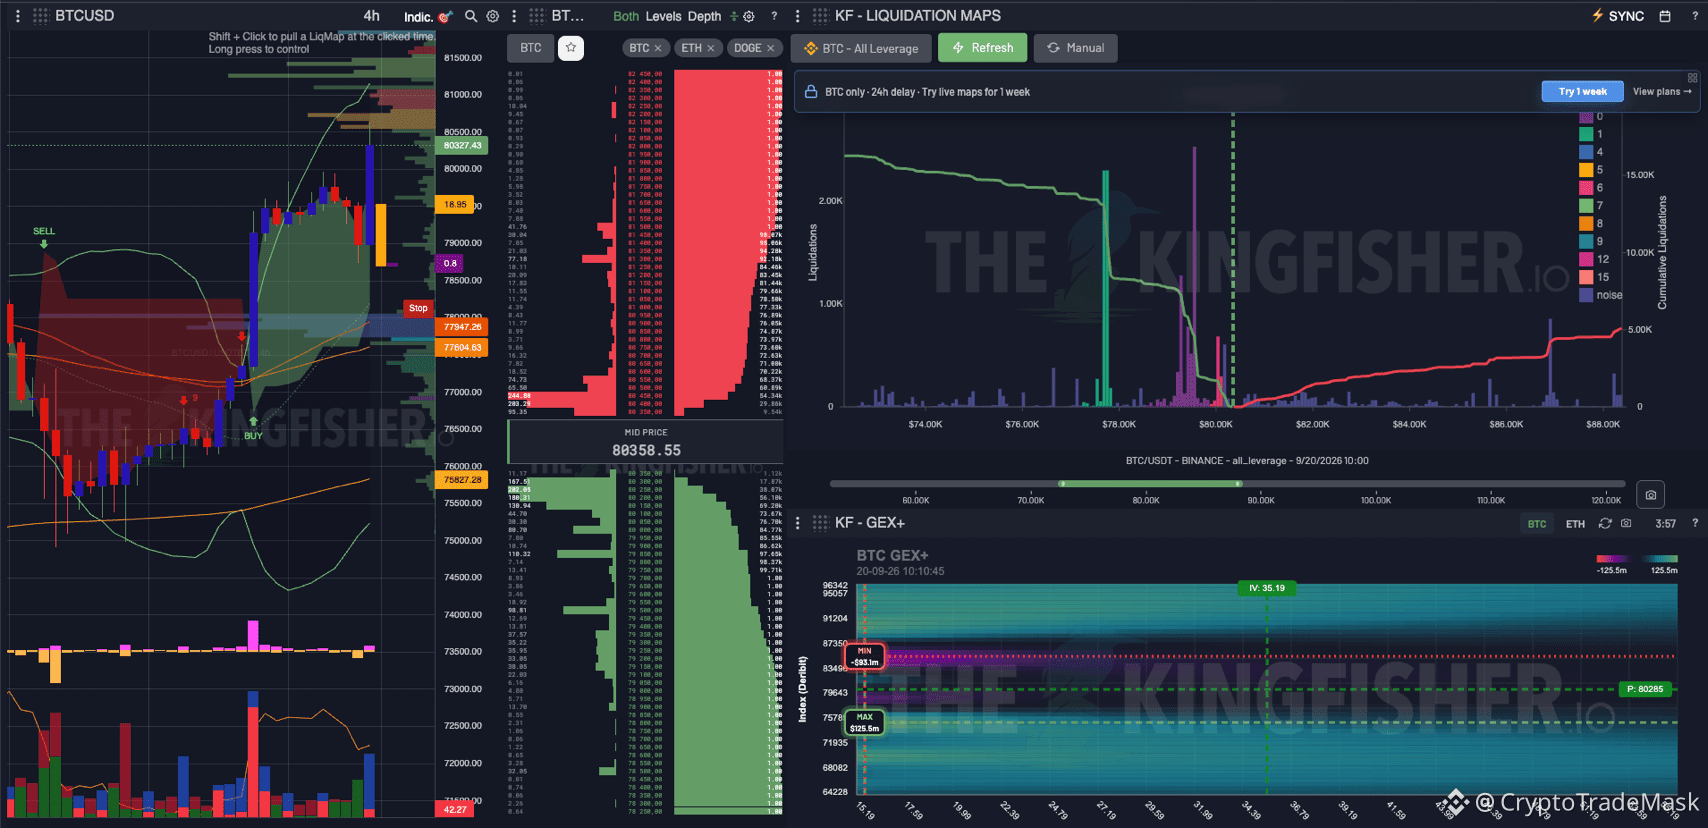
The platform provides a clear picture of the current situation with Bitcoin and where the "big money" (liquidity) is concentrated. We’ve broken down the key levels and potential scenarios for you!
🎯 What is the current situation?
Current Price (Mid Price): ~$80,358
Context: After a powerful rally from $72,000, the price hit resistance above $81,000, triggered a SELL signal, and entered a period of local consolidation.
🧲 Where are the liquidity magnets?
➡️ Downside (Long Liquidations):
The densest pool of long liquidations lies in the $77,500 – $78,000 range. Key technical support levels based on the volume profile are also located here.
➡️ Upside (Short Liquidations):
The pool of short stop-losses extends from $81,000 to $88,000. We see the largest liquidation "spike" near the $88,000 mark—this is the primary medium-term target for the bulls.
➡️ Gamma Exposure (GEX+):
$83,450 (MIN GEX): A breakout above this level could trigger a massive short squeeze.
$75,780 (MAX GEX): Rock-solid support provided by market makers.
🚦 Potential Scenarios:
🟡 Priority (Liquidity Sweep – Growth):
The market often performs a "manipulation"—dropping to the $78,000–$79,000 zone to shake out over-leveraged long positions and sweep liquidity. This is followed by a reversal and a push toward $81,500–$84,000+.
🟢 Aggressively Bullish (Direct Breakout):
A 4-hour candle close above $81,000 paves the way to $83,450 and subsequently to $86,000–$88,000.
🔴 Negative (Bearish):
Losing the $77,500 support level would trigger a deeper correction toward $75,780.
🚀 $BTC /USD Market Overview: Where will the price go next? 📊
The platform provides a clear picture of the current situation with Bitcoin and where the "big money" (liquidity) is concentrated. We’ve broken down the key levels and potential scenarios for you!
🎯 What is the current situation?
Current Price (Mid Price): ~$80,358
Context: After a powerful rally from $72,000, the price hit resistance above $81,000, triggered a SELL signal, and entered a period of local consolidation.
🧲 Where are the liquidity magnets?
➡️ Downside (Long Liquidations):
The densest pool of long liquidations lies in the $77,500 – $78,000 range. Key technical support levels based on the volume profile are also located here.
➡️ Upside (Short Liquidations):
The pool of short stop-losses extends from $81,000 to $88,000. We see the largest liquidation "spike" near the $88,000 mark—this is the primary medium-term target for the bulls.
➡️ Gamma Exposure (GEX+):
$83,450 (MIN GEX): A breakout above this level could trigger a massive short squeeze.
$75,780 (MAX GEX): Rock-solid support provided by market makers.
🚦 Potential Scenarios:
🟡 Priority (Liquidity Sweep – Growth):
The market often performs a "manipulation"—dropping to the $78,000–$79,000 zone to shake out over-leveraged long positions and sweep liquidity. This is followed by a reversal and a push toward $81,500–$84,000+.
🟢 Aggressively Bullish (Direct Breakout):
A 4-hour candle close above $81,000 paves the way to $83,450 and subsequently to $86,000–$88,000.
🔴 Negative (Bearish):
Losing the $77,500 support level would trigger a deeper correction toward $75,780.