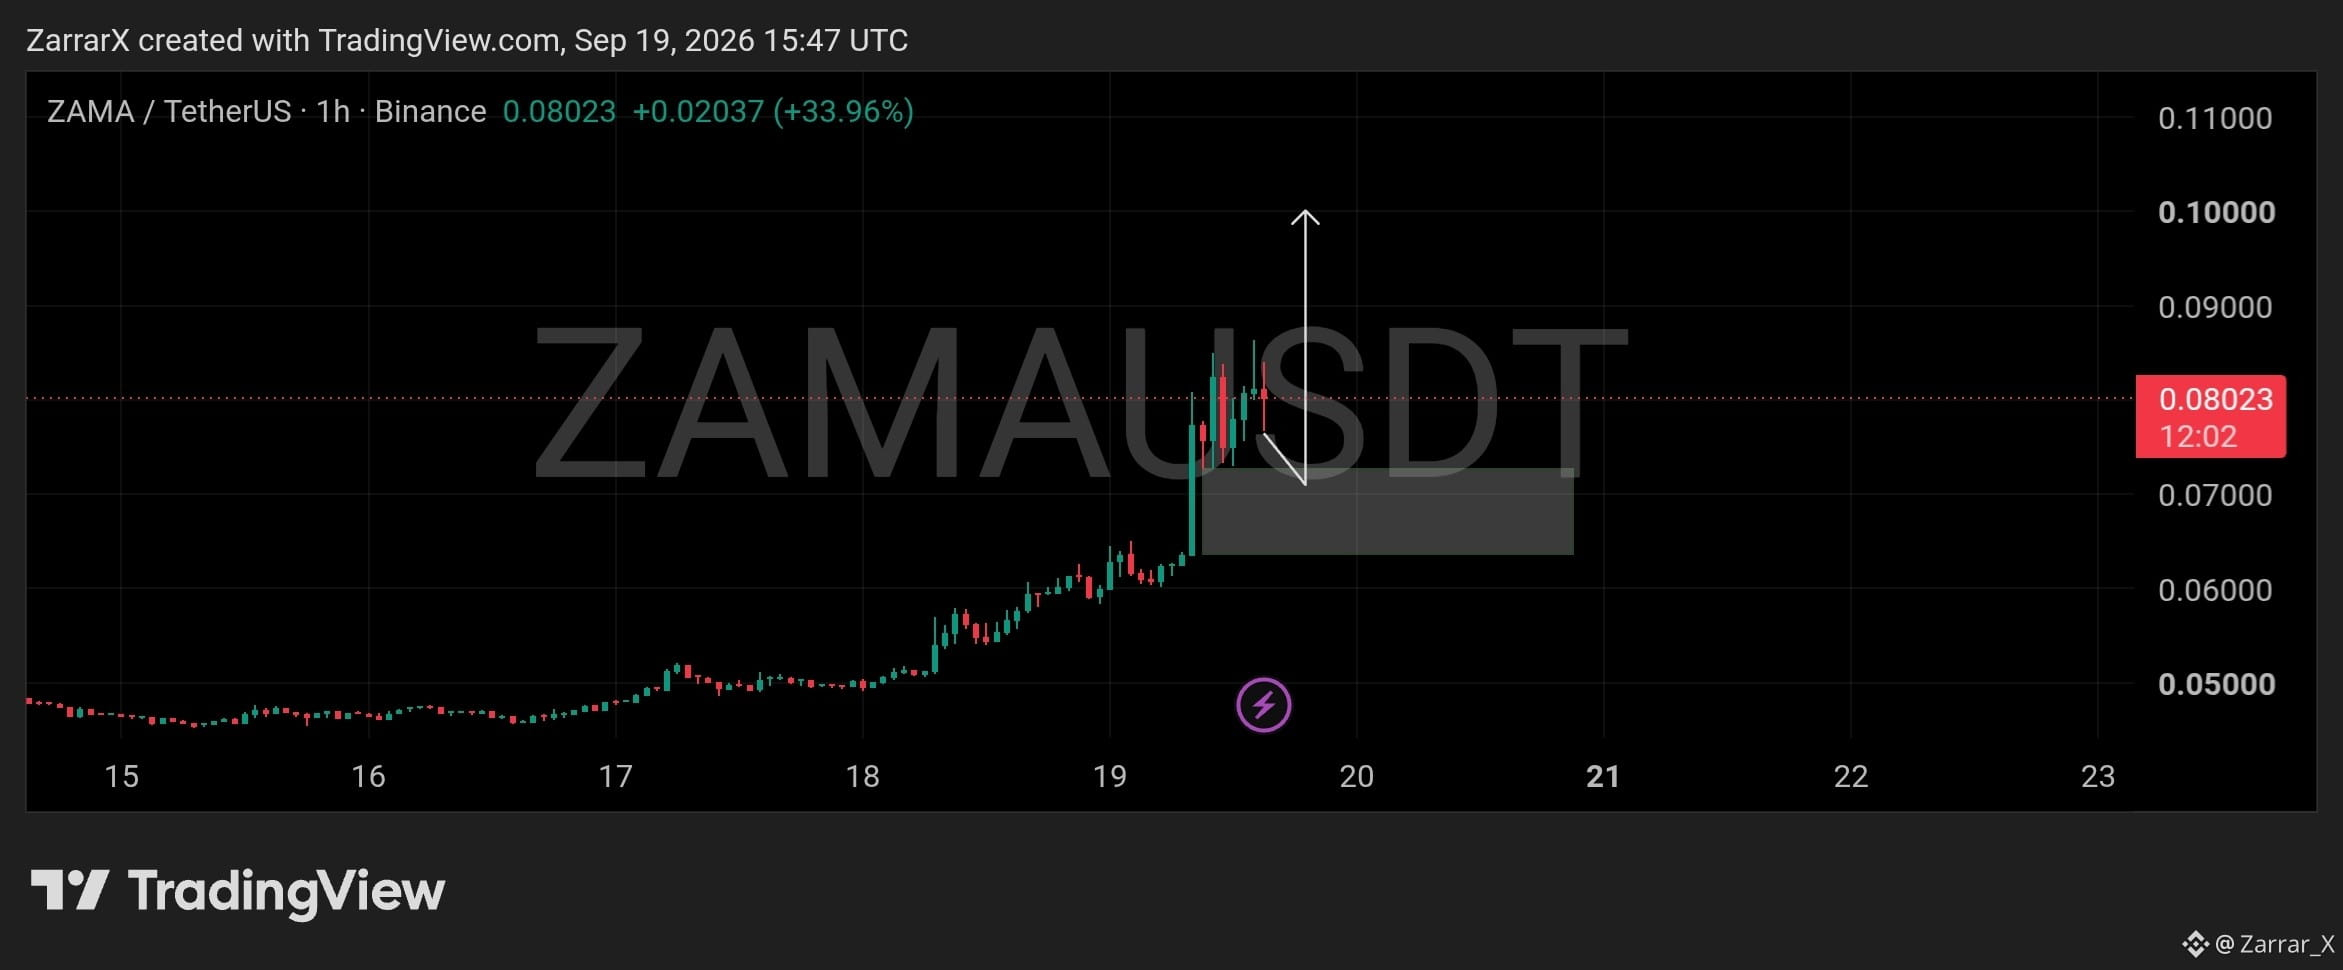
$ZAMA has pushed sharply higher on the 1H chart, climbing from the $0.05 area into the $0.08 region. After the breakout, price is now consolidating around $0.075-$0.083 rather than giving back the full move.
The marked demand zone around $0.064-$0.073 is the key area to watch on a pullback. A reaction there would keep the current bullish structure intact and could give price room to continue higher.
As long as that demand holds, $ZAMA can continue working toward the $0.10 area shown on the chart. A deeper breakdown through the zone would weaken this structure and suggest the breakout is losing momentum.
#Zama #altcoins
The marked demand zone around $0.064-$0.073 is the key area to watch on a pullback. A reaction there would keep the current bullish structure intact and could give price room to continue higher.
As long as that demand holds, $ZAMA can continue working toward the $0.10 area shown on the chart. A deeper breakdown through the zone would weaken this structure and suggest the breakout is losing momentum.
#Zama #altcoins