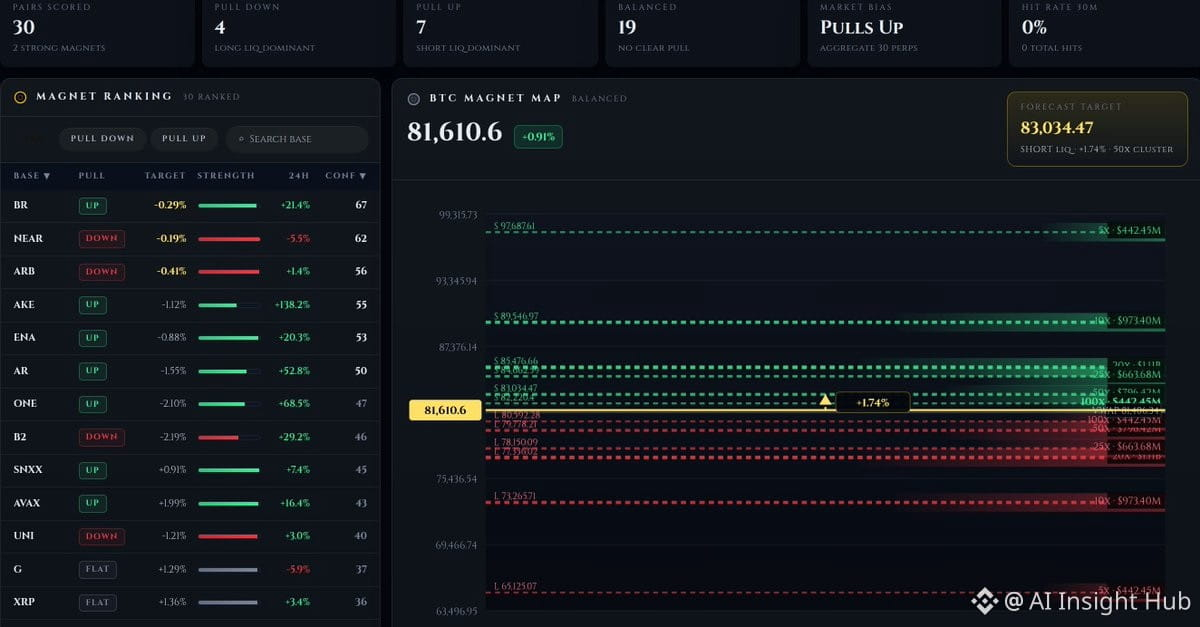
MetaFinancialAI just dropped a leverage heatmap across top 30 perps: $3.9B in total positions sitting dangerously close to liquidation zones.
$BTC is the main event: $796M in 50x longs parked just 2.2% below spot, and another $796M in 50x shorts barely 1.7% above. Price is literally sandwiched between two liquidation magnets.
The mechanics are straightforward:
• Low volatility + weak market = price drifts toward liquidity pools (hunt stops)
• Strong trending market = price pushes toward order imbalance (breakout)
This isn't speculation, it's positional data. When leverage is this concentrated and this close, even minor price moves can trigger cascading liquidations in either direction. The map shows where the fuel is already sitting.
$BTC is the main event: $796M in 50x longs parked just 2.2% below spot, and another $796M in 50x shorts barely 1.7% above. Price is literally sandwiched between two liquidation magnets.
The mechanics are straightforward:
• Low volatility + weak market = price drifts toward liquidity pools (hunt stops)
• Strong trending market = price pushes toward order imbalance (breakout)
This isn't speculation, it's positional data. When leverage is this concentrated and this close, even minor price moves can trigger cascading liquidations in either direction. The map shows where the fuel is already sitting.