
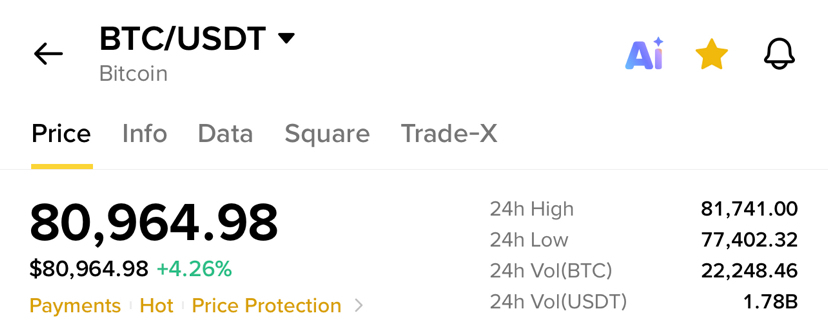

The cryptocurrency market has been displaying intense price action over the past few days, with Bitcoin ($BTC ) fluctuating around the $80,0

00–$82,000 price range. Traders and investors are closely watching key technical indicators to determine whether the market will break out to new highs or undergo a deeper correction.
🔑 1. Technical Analysis & Market Overview
Bitcoin recently bounced off the lower support levels around $77,400 and pushed back above $80,000, signaling strong buying interest near key psychological levels.
• Immediate Resistance: The primary resistance lies between $81,500 and $82,000. A decisive daily close above this zone could spark a bullish continuation towards $85,000.
• Key Support Zone: If the price gets rejected from the resistance, the immediate support zone to watch is $78,500, followed by the major support level at $77,400.
📊 2. Market Sentiment and Volume Indicator
Trading volume plays a crucial role in validating price movements. Recent volume spikes indicate active participation from both retail and institutional traders. Moving Averages (MA 60) on short-term timeframes suggest a potential consolidation phase before the next major movement.
💡 3. What Strategy Should Traders Adopt?
• Spot Investors: Dollar-Cost Averaging (DCA) around major support levels remains a safer approach during volatile periods.
• Futures Traders: Exercise strict risk management, keep leverage low, and always set Stop-Loss (SL) orders to protect your capital.
❓ Community Discussion
What is your target for $BTC this week? Do you expect a breakout above $82k, or are we going to see a short-term pullback? Let us know your trading plans in the comments!
#BTC #Bitcoin #CryptoMarket #BinanceSquare #TechnicalAnalysis $BTC