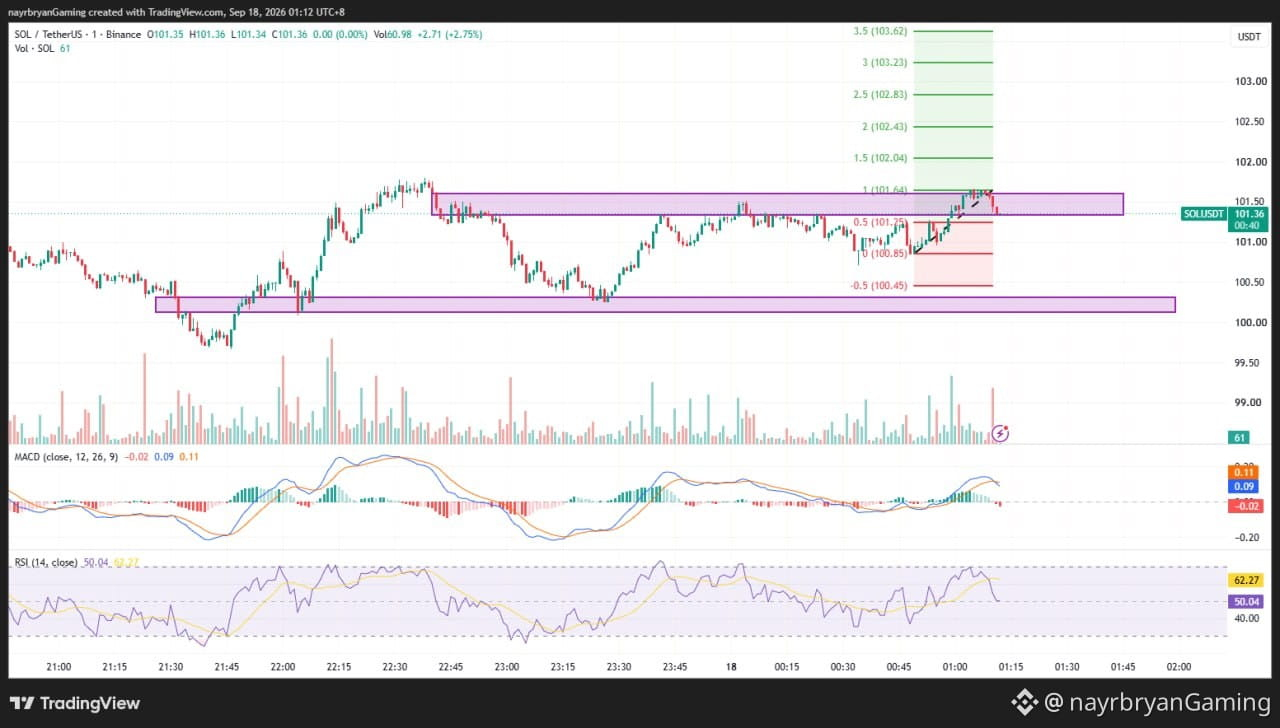
LIGHT ANALYSIS / CHART SETUP — SOL/USDT
📈 Structure Overview
Market phase: Consolidation → Breakout → Retest
Current price: 101.37
Key reaction zone: 101.25 – 101.44
Breakout resistance: 101.64
Major overhead resistance: 101.78
Invalidation: 100.85
Lower support: 100.12 – 100.32
📌 What I’m Watching
Scenario A — Bullish Continuation
If SOL holds the 101.25–101.44 reaction zone and reclaims 101.64, price may rotate toward:
102.04 → 102.43 → 102.83 → 103.23 → 103.62
These levels correspond with the Fibonacci extensions marked on the chart.
Scenario B — Support Failure
If SOL loses 101.25 and then breaks 100.85, the recent bullish structure weakens.
The next important area visible on the chart is:
100.12 → 100.32
📊 Indicator Check
MACD: Above zero → positive momentum remains, but momentum is cooling
RSI: 50.56 → neutral zone
Price Structure: Breakout + retest of previous structure
Key Confirmation: 101.64 reclaim / 100.85 breakdown
Note: This is a chart framework, not a trade recommendation. Use it to support your own DYOR-based execution plan.
— @nayrbryanGaming #SOLAnalysis #ChartSetup #PriceAction #SmartMoney #Fibonacci #CryptoTrading #DYOR #NFA
📈 Structure Overview
Market phase: Consolidation → Breakout → Retest
Current price: 101.37
Key reaction zone: 101.25 – 101.44
Breakout resistance: 101.64
Major overhead resistance: 101.78
Invalidation: 100.85
Lower support: 100.12 – 100.32
📌 What I’m Watching
Scenario A — Bullish Continuation
If SOL holds the 101.25–101.44 reaction zone and reclaims 101.64, price may rotate toward:
102.04 → 102.43 → 102.83 → 103.23 → 103.62
These levels correspond with the Fibonacci extensions marked on the chart.
Scenario B — Support Failure
If SOL loses 101.25 and then breaks 100.85, the recent bullish structure weakens.
The next important area visible on the chart is:
100.12 → 100.32
📊 Indicator Check
MACD: Above zero → positive momentum remains, but momentum is cooling
RSI: 50.56 → neutral zone
Price Structure: Breakout + retest of previous structure
Key Confirmation: 101.64 reclaim / 100.85 breakdown
Note: This is a chart framework, not a trade recommendation. Use it to support your own DYOR-based execution plan.
— @nayrbryanGaming #SOLAnalysis #ChartSetup #PriceAction #SmartMoney #Fibonacci #CryptoTrading #DYOR #NFA