How to Read an ETF Outflow Week (Without Panicking)
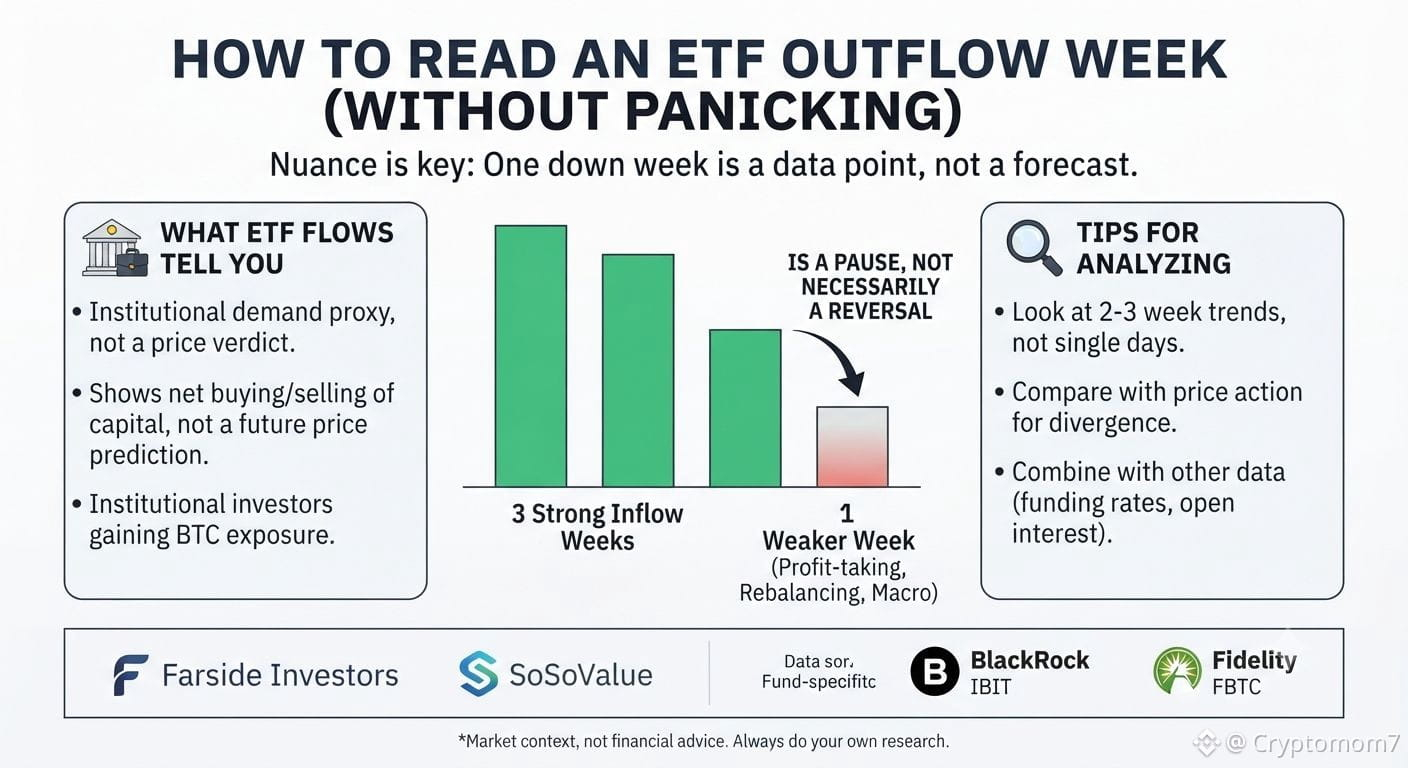
Spot BTC ETFs just posted a weaker inflow week after three consecutive strong ones. Headlines will call this a warning sign — but ETF flow data is more nuanced than "money in = bullish, money out = bearish." Here's how to actually read it.
What ETF flows tell you
Spot Bitcoin ETFs let institutions and traditional investors buy BTC exposure through regular brokerage accounts. Daily inflow/outflow data shows whether that pool of capital is net buying or net selling on a given day — it's a proxy for institutional demand, not a verdict on Bitcoin's future price.
Why one down week isn't automatically bearish
A single weaker week can reflect profit-taking after a run-up, portfolio rebalancing, macro caution (rate decisions, inflation data), or simply lower trading volume — not a change in long-term conviction. Three strong weeks followed by one soft one is a pause, not a reversal, until the trend actually confirms it.
Where to check the data yourself
• Farside Investors — free daily net flow tracker across all U.S. spot BTC ETFs
• SoSoValue — flow data plus historical charts
• Individual issuer sites (BlackRock's IBIT, Fidelity's FBTC, etc.) for fund-specific numbers
A few practical tips
• Look at flow trends over 2–3 weeks, not single days
• Compare flows against price action — divergence is more meaningful than either alone
• Combine flow data with other signals (funding rates, open interest) rather than trading off it alone
One outflow week is a data point, not a forecast. Context and trend matter more than any single number.
This is market context, not financial advice. Always do your own research.
Spot BTC ETFs just posted a weaker inflow week after three consecutive strong ones. Headlines will call this a warning sign — but ETF flow data is more nuanced than "money in = bullish, money out = bearish." Here's how to actually read it.
What ETF flows tell you
Spot Bitcoin ETFs let institutions and traditional investors buy BTC exposure through regular brokerage accounts. Daily inflow/outflow data shows whether that pool of capital is net buying or net selling on a given day — it's a proxy for institutional demand, not a verdict on Bitcoin's future price.
Why one down week isn't automatically bearish
A single weaker week can reflect profit-taking after a run-up, portfolio rebalancing, macro caution (rate decisions, inflation data), or simply lower trading volume — not a change in long-term conviction. Three strong weeks followed by one soft one is a pause, not a reversal, until the trend actually confirms it.
Where to check the data yourself
• Farside Investors — free daily net flow tracker across all U.S. spot BTC ETFs
• SoSoValue — flow data plus historical charts
• Individual issuer sites (BlackRock's IBIT, Fidelity's FBTC, etc.) for fund-specific numbers
A few practical tips
• Look at flow trends over 2–3 weeks, not single days
• Compare flows against price action — divergence is more meaningful than either alone
• Combine flow data with other signals (funding rates, open interest) rather than trading off it alone
One outflow week is a data point, not a forecast. Context and trend matter more than any single number.
This is market context, not financial advice. Always do your own research.