$ONE /USDT — 1H chart analysis 📊
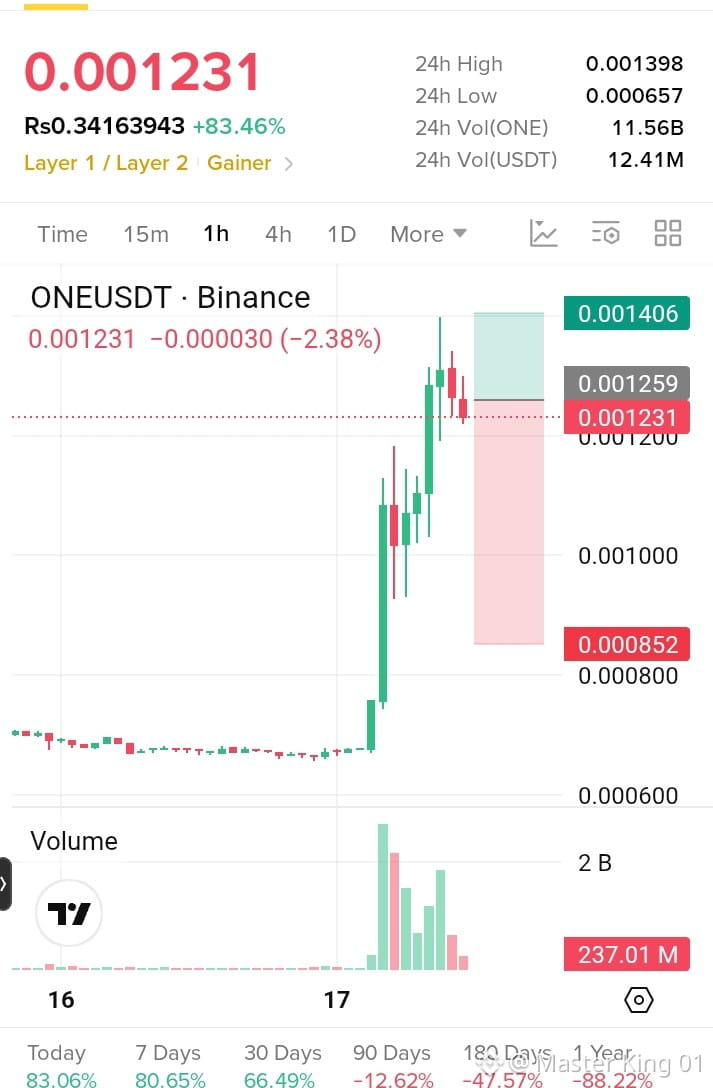
Current price: 0.001231
Entry shown: 0.001259
Target: 0.001406
Stop-loss: 0.000852
24h high: 0.001398
24h low: 0.000657
What the chart shows
The coin has made a very strong breakout, rising more than 80% in 24h. Volume also expanded heavily, confirming strong participation.
But on the 1H chart, price is now showing rejection around 0.00130–0.00140 with several red candles. After such a sharp move, a pullback/consolidation is possible.
Important levels:
🟢 0.00120–0.00123: immediate support area
🟡 0.00125–0.00126: your shown entry/resistance area
🔴 0.00130–0.00140: major resistance zone
🎯 0.001406: breakout target / recent high area
If 0.00120 holds and buyers return with volume, the chart could attempt another move toward 0.00130 → 0.00140. A sustained move below 0.00120 would weaken the short-term bullish structure.
Because this is already an extremely volatile pump, the 0.000852 stop shown on the chart is very far from the entry, so the position carries substantial downside risk if that stop is actually being used.
Current price: 0.001231
Entry shown: 0.001259
Target: 0.001406
Stop-loss: 0.000852
24h high: 0.001398
24h low: 0.000657
What the chart shows
The coin has made a very strong breakout, rising more than 80% in 24h. Volume also expanded heavily, confirming strong participation.
But on the 1H chart, price is now showing rejection around 0.00130–0.00140 with several red candles. After such a sharp move, a pullback/consolidation is possible.
Important levels:
🟢 0.00120–0.00123: immediate support area
🟡 0.00125–0.00126: your shown entry/resistance area
🔴 0.00130–0.00140: major resistance zone
🎯 0.001406: breakout target / recent high area
If 0.00120 holds and buyers return with volume, the chart could attempt another move toward 0.00130 → 0.00140. A sustained move below 0.00120 would weaken the short-term bullish structure.
Because this is already an extremely volatile pump, the 0.000852 stop shown on the chart is very far from the entry, so the position carries substantial downside risk if that stop is actually being used.