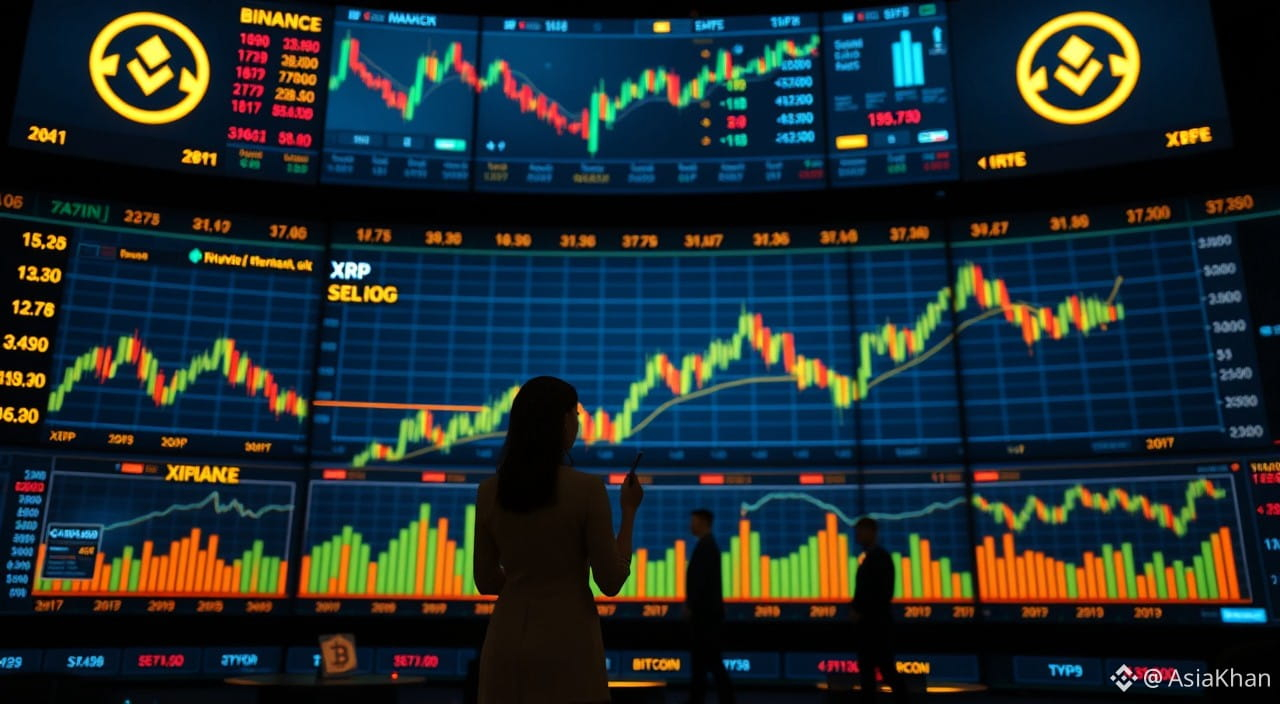
Mastering candlestick charts is one of the most effective ways to analyze market sentiment and spot potential price trends before they unfold. Whether you are tracking major market moves or watching tokens like $XRP surge over 8% to reach $1.47, understanding price action through green and red candles provides crucial insights into the battle between buyers and sellers.
By identifying key candlestick patterns—such as bullish engulfing signals, hammers, or dojis—traders can better time their entries and exits on Binance. Combining these technical patterns with volume indicators helps confirm market momentum and manage risk in volatile conditions.
Technical tools improve your market awareness, but no strategy guarantees profits. Always practice strict risk management and do your own research. NFA (
By identifying key candlestick patterns—such as bullish engulfing signals, hammers, or dojis—traders can better time their entries and exits on Binance. Combining these technical patterns with volume indicators helps confirm market momentum and manage risk in volatile conditions.
Technical tools improve your market awareness, but no strategy guarantees profits. Always practice strict risk management and do your own research. NFA (