$XRP
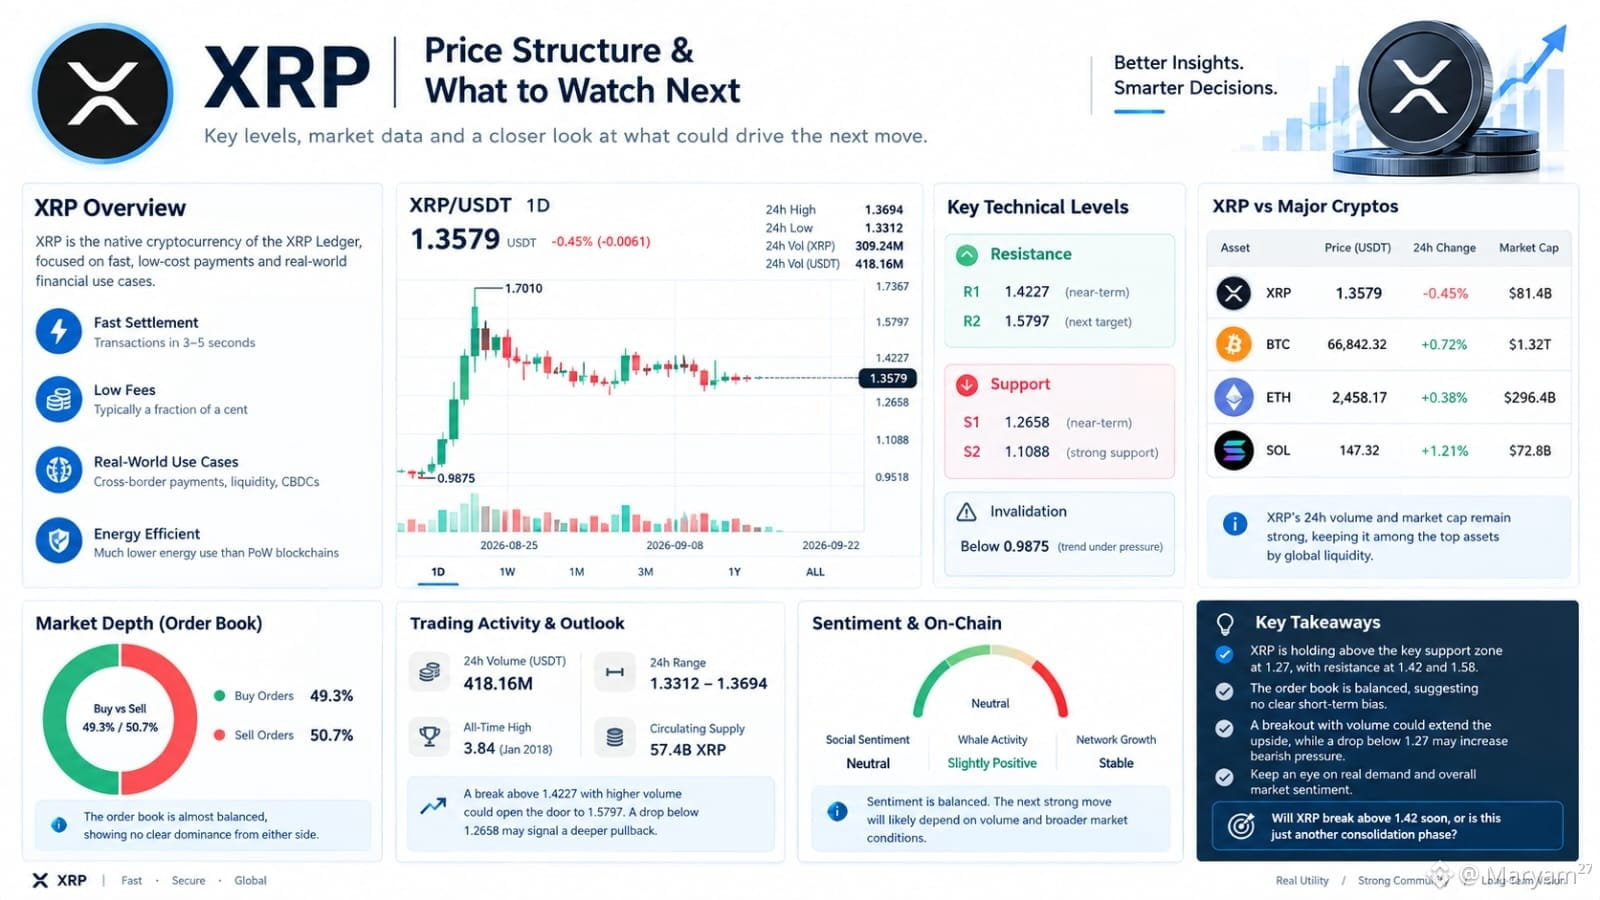
I keep coming back to one detail on the XRP chart that looks easy to ignore: price is holding around $1.36, but the daily structure still has a lot of unfinished work above it. After the sharp move from roughly $0.99 to the $1.70 area, XRP has spent weeks compressing instead of immediately extending the trend. That matters because a strong move followed by sideways trading can be either healthy absorption or simply a market losing momentum.
What I’m testing mentally is the reaction around $1.42. On this chart, that zone has repeatedly acted like a decision area. If buyers can reclaim it and stay above it, the distance to $1.58 is about 11%, while a move back toward $1.27 would represent roughly 6.6% downside from $1.36. That creates an interesting asymmetry, but only if the breakout is supported by real spot demand rather than short-term leverage.#xrp #BinanceSquareTalks $XRP
I keep coming back to one detail on the XRP chart that looks easy to ignore: price is holding around $1.36, but the daily structure still has a lot of unfinished work above it. After the sharp move from roughly $0.99 to the $1.70 area, XRP has spent weeks compressing instead of immediately extending the trend. That matters because a strong move followed by sideways trading can be either healthy absorption or simply a market losing momentum.
What I’m testing mentally is the reaction around $1.42. On this chart, that zone has repeatedly acted like a decision area. If buyers can reclaim it and stay above it, the distance to $1.58 is about 11%, while a move back toward $1.27 would represent roughly 6.6% downside from $1.36. That creates an interesting asymmetry, but only if the breakout is supported by real spot demand rather than short-term leverage.#xrp #BinanceSquareTalks $XRP