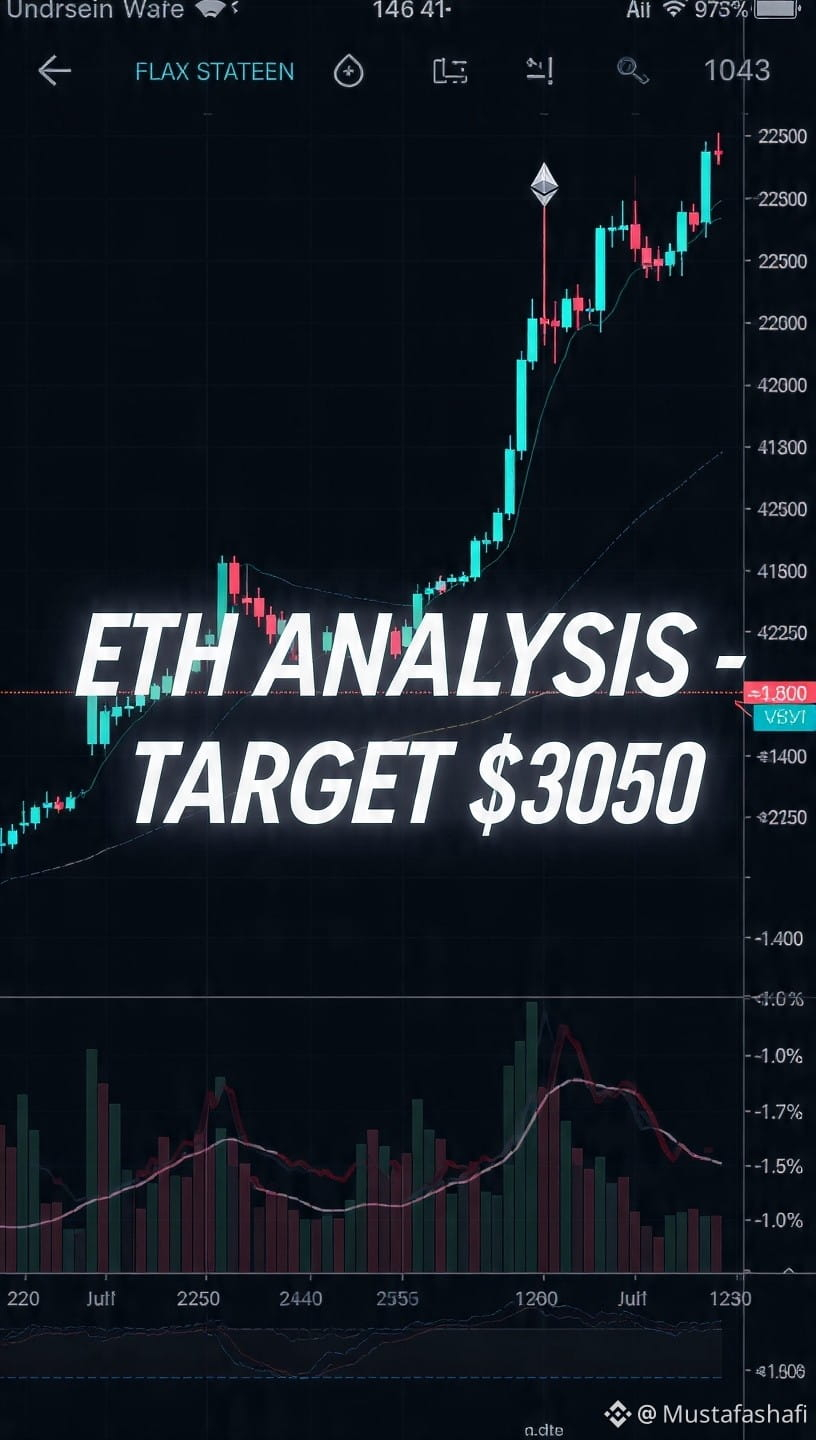
$ETH *ETH Analysis - September 13, 2026* 📊
*1. Current Price Snapshot*
- *Price:* $2,505 - $2,512
- *24H Change:* -0.77% to +2.88% depending on source
- *Market Cap:* ∼$308 Billion
- *30-Day Return:* +33.63% but still -49.2% from ATH $4,946
5c956b86
*2. Technical Analysis*
*Bullish Setup: Bull Flag*
ETH just did a 37% rally to $2,564, and now it's consolidating sideways. This is forming a "bull flag" pattern.
- *Upside Target:* ∼$3,050. This is also reinforced by Jan 2026 highs at $3,040-$3,060
- *Key Resistance:* $2,656 first, then $2,787
- *Key Support:* $2,431 broke briefly. Next supports: $2,350-$2,360 flag base, $2,310 20-day EMA, then $2,220 200-day EMA
14626507
*Momentum:* RSI mid-60s, Stoch in overbought. Price still above major EMAs = near-term bullish bias
*3. Fundamentals & Narrative*
- *Relative Strength:* On Sep 11, ETH only fell 1.26% while BTC fell 1.99%. ETH outperformed top 10, showing defensive positioning
- *Supply Factor:* More ETH locked in staking = less selling pressure
- *Bullish Forecasts:*
- Standard Chartered: $4,000 end-2026, $10,000 in 2027, $40,000 by 2030
- Arthur Hayes: $10,000 year-end 2026 target
- *Bearish Risks:* ECB rate hike 25bps + US rate hike odds at 74%. Oil >$100 + Middle East tensions. EU watchdog warns of "abrupt market correction" risk
6507954ecbb3184c7138
*4. What to Watch Next*
1. *$2,350-$2,360:* If ETH breaks below this, bull flag fails and could reverse
2. *$3,050:* Technical target from bull flag pole height
3. *Macro:* US inflation report + Fed rate hike expectations
1462e645
*Summary*
ETH is in a consolidation phase after a strong +33% monthly run. Charts look bullish with a $3,050 target, but macro headwinds from rate hikes could cause a pullback to $2,350. Long-term calls are very bullish, but short-term depends on holding $2,350 support.
Want me to make a *trading plan* with entry, SL, TP levels based on this? Or do you want *ETH vs BTC* comparison too? 5c956b861462184c
*1. Current Price Snapshot*
- *Price:* $2,505 - $2,512
- *24H Change:* -0.77% to +2.88% depending on source
- *Market Cap:* ∼$308 Billion
- *30-Day Return:* +33.63% but still -49.2% from ATH $4,946
5c956b86
*2. Technical Analysis*
*Bullish Setup: Bull Flag*
ETH just did a 37% rally to $2,564, and now it's consolidating sideways. This is forming a "bull flag" pattern.
- *Upside Target:* ∼$3,050. This is also reinforced by Jan 2026 highs at $3,040-$3,060
- *Key Resistance:* $2,656 first, then $2,787
- *Key Support:* $2,431 broke briefly. Next supports: $2,350-$2,360 flag base, $2,310 20-day EMA, then $2,220 200-day EMA
14626507
*Momentum:* RSI mid-60s, Stoch in overbought. Price still above major EMAs = near-term bullish bias
*3. Fundamentals & Narrative*
- *Relative Strength:* On Sep 11, ETH only fell 1.26% while BTC fell 1.99%. ETH outperformed top 10, showing defensive positioning
- *Supply Factor:* More ETH locked in staking = less selling pressure
- *Bullish Forecasts:*
- Standard Chartered: $4,000 end-2026, $10,000 in 2027, $40,000 by 2030
- Arthur Hayes: $10,000 year-end 2026 target
- *Bearish Risks:* ECB rate hike 25bps + US rate hike odds at 74%. Oil >$100 + Middle East tensions. EU watchdog warns of "abrupt market correction" risk
6507954ecbb3184c7138
*4. What to Watch Next*
1. *$2,350-$2,360:* If ETH breaks below this, bull flag fails and could reverse
2. *$3,050:* Technical target from bull flag pole height
3. *Macro:* US inflation report + Fed rate hike expectations
1462e645
*Summary*
ETH is in a consolidation phase after a strong +33% monthly run. Charts look bullish with a $3,050 target, but macro headwinds from rate hikes could cause a pullback to $2,350. Long-term calls are very bullish, but short-term depends on holding $2,350 support.
Want me to make a *trading plan* with entry, SL, TP levels based on this? Or do you want *ETH vs BTC* comparison too? 5c956b861462184c