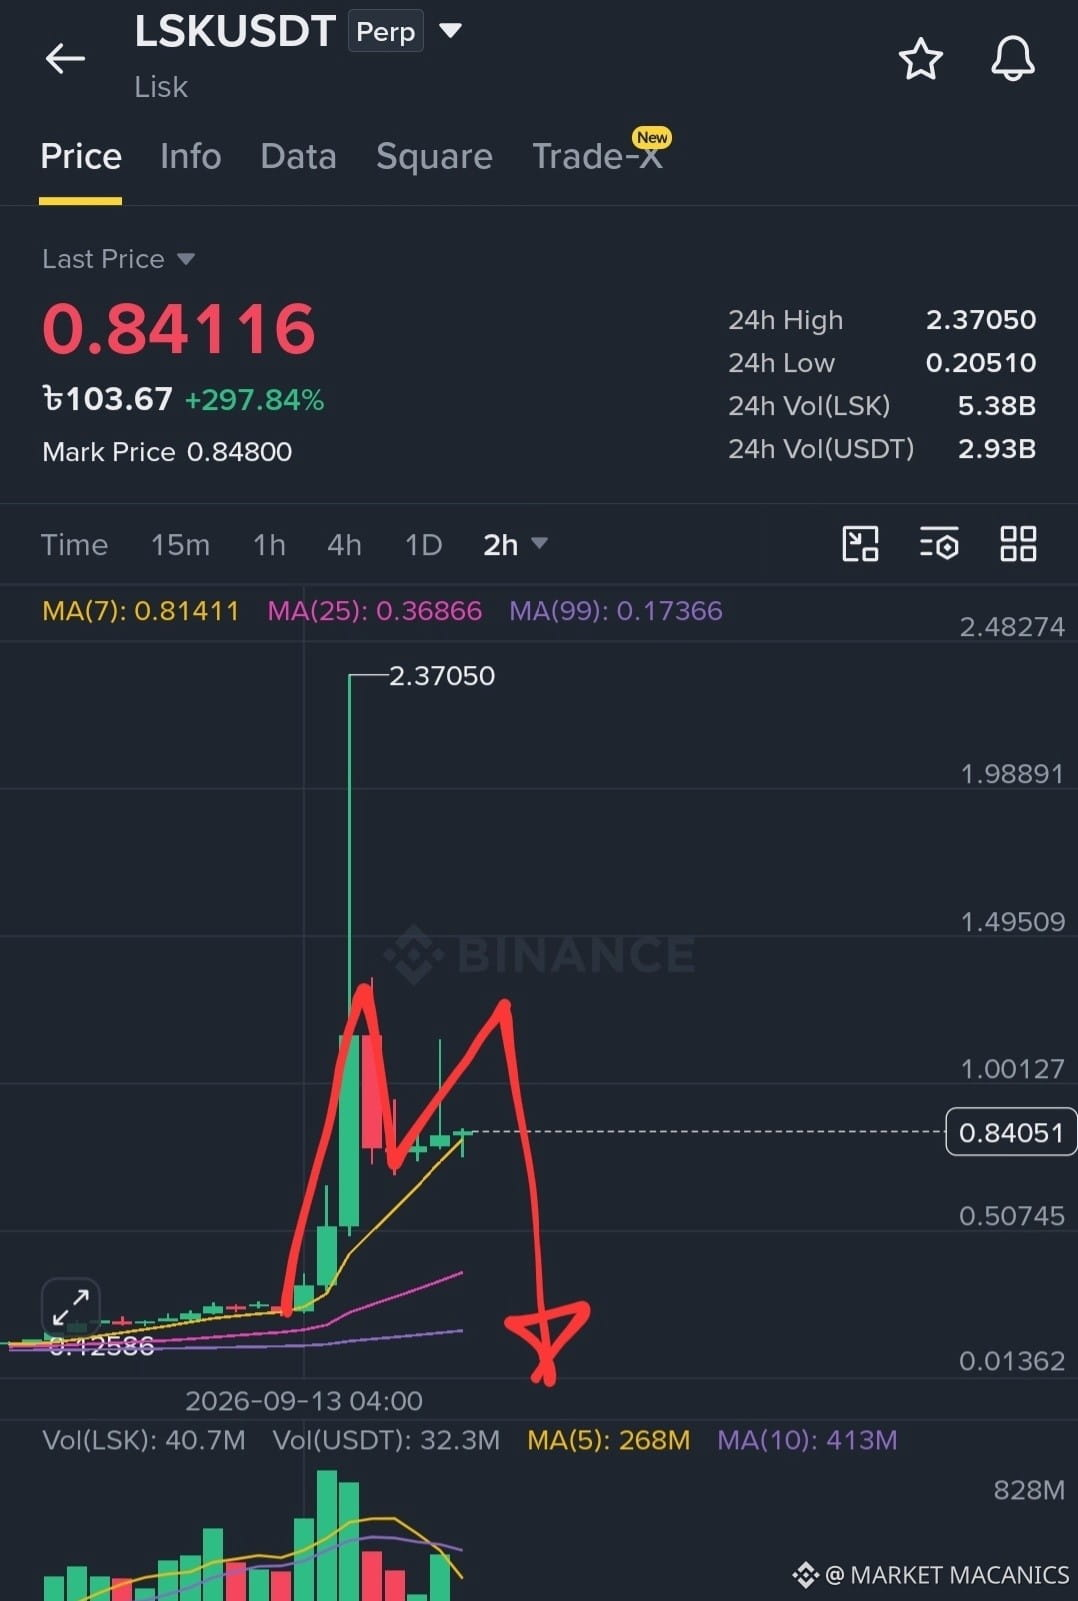
$LSK LSK Bearish M Pattern: Sellers Signal a Potential Breakdown 📉
The LSK market structure is showing a bearish M pattern, a formation that often signals weakening momentum after repeated attempts to push higher. The two peaks suggest buyers are struggling to maintain control, while the middle support zone becomes increasingly important. If price fails to hold this neckline, selling pressure could accelerate and create a deeper downside move. Traders should watch volume and price reaction closely before considering the next directional opportunity.
A confirmed breakdown below the neckline would strengthen the bearish setup, especially if sellers appear with rising volume. This could indicate that the previous bullish momentum has lost strength and that market participants are shifting toward protecting positions or opening short trades. However, traders should avoid entering solely because the pattern is visible; confirmation remains essential to reduce the risk of a false breakdown.
The LSK setup also highlights the importance of resistance created by the two highs. Unless buyers can reclaim that region decisively, the market may continue respecting the bearish structure. Repeated rejection from resistance can encourage sellers and push price toward lower support areas. A failed breakdown, on the other hand, could invalidate the pattern and produce a sharp recovery.
📊 Overall, the bearish M pattern places LSK under pressure and keeps downside continuation as a key scenario. Traders should monitor the neckline, volume expansion, and rejection signals for confirmation. If support breaks convincingly, the pattern could become increasingly active, while a strong move above the second peak would weaken the bearish thesis.
$LSK
$ARK
The LSK market structure is showing a bearish M pattern, a formation that often signals weakening momentum after repeated attempts to push higher. The two peaks suggest buyers are struggling to maintain control, while the middle support zone becomes increasingly important. If price fails to hold this neckline, selling pressure could accelerate and create a deeper downside move. Traders should watch volume and price reaction closely before considering the next directional opportunity.
A confirmed breakdown below the neckline would strengthen the bearish setup, especially if sellers appear with rising volume. This could indicate that the previous bullish momentum has lost strength and that market participants are shifting toward protecting positions or opening short trades. However, traders should avoid entering solely because the pattern is visible; confirmation remains essential to reduce the risk of a false breakdown.
The LSK setup also highlights the importance of resistance created by the two highs. Unless buyers can reclaim that region decisively, the market may continue respecting the bearish structure. Repeated rejection from resistance can encourage sellers and push price toward lower support areas. A failed breakdown, on the other hand, could invalidate the pattern and produce a sharp recovery.
📊 Overall, the bearish M pattern places LSK under pressure and keeps downside continuation as a key scenario. Traders should monitor the neckline, volume expansion, and rejection signals for confirmation. If support breaks convincingly, the pattern could become increasingly active, while a strong move above the second peak would weaken the bearish thesis.
$LSK
$ARK