$LSK LSK/USDC — Latest Analysis
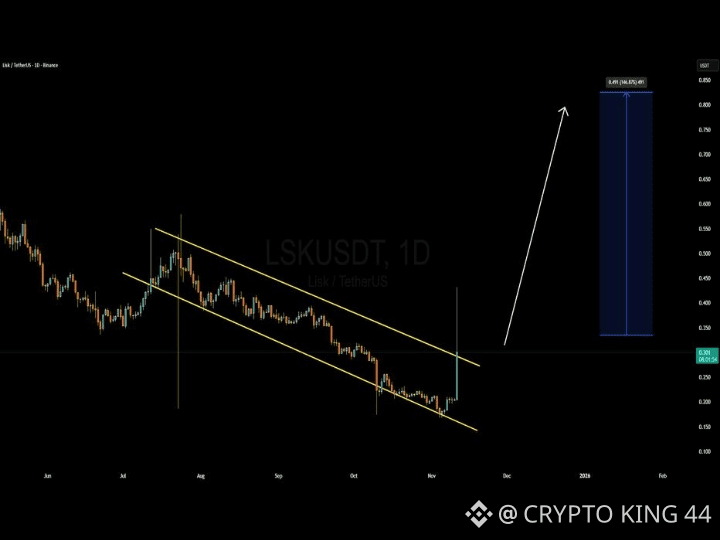
Current picture: LSK has just experienced an extremely strong breakout. Latest data puts LSK around $0.23–$0.25, while USDC remains essentially $1.00.
📈 Technical view
Trend: Strongly bullish in the short term.
Momentum: Extremely high — RSI is reported around 96, which means the move is severely overbought.
Volume: Explosive; reported 24h turnover is around $3.5B, with volume roughly 52× its normal level.
LSK moved from roughly $0.10 on Sept. 10 to above $0.25, so chasing the move carries substantial pullback risk.
🎯 Important levels
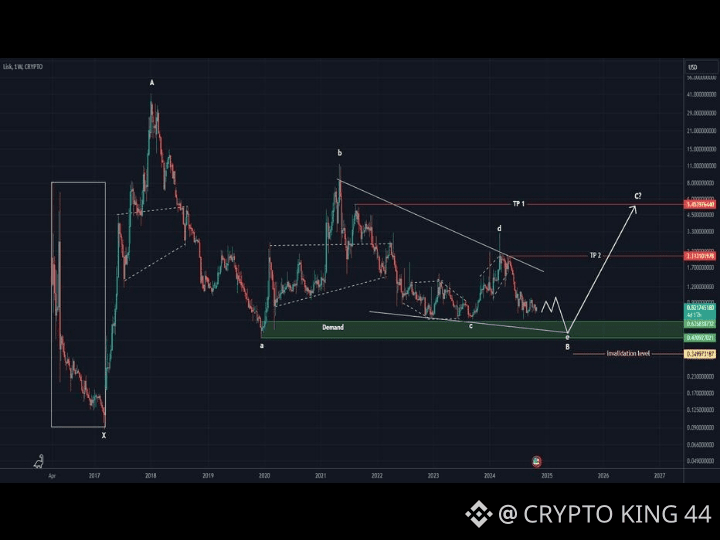
LevelImportance$0.26–0.27🔴 Major near-term resistance$0.30🔴 Psychological resistance$0.33–0.34🚀 Bullish breakout target$0.23–0.24🟢 First support$0.20–0.21🟢 Stronger support$0.18–0.19🟢 Critical pullback zone
A recent LSK trade signal had targets at $0.204, $0.215 and $0.23, all of which were reached; this confirms how rapidly the current move has developed.
🔥 My scenario
Bullish: If LSK holds $0.23–0.24 and breaks $0.26–0.27 with volume, I would watch $0.30 → $0.33/0.34 next.
Correction: Because RSI is around 96, a sharp retracement is very possible. A loss of $0.23 could send price toward $0.20–0.21. Losing $0.20 would weaken the immediate bullish structure.
Best approach: I would not chase a huge green candle here. A pullback/retest around $0.21–$0.24 with stabilization would offer a much cleaner risk/reward setup.
Overall: 🟢 Bullish trend / 🔴 extremely overbought. The trend favors buyers, but the probability of a violent correction is also elevated.
This is technical analysis, not financial advice. LSK is currently exceptionally volatile.
#ClarityActFacesProceduralVoteSept15 #US10YearTreasuryYieldNears5% #RevolutConfirmsFakeGovEmailDataBreach
Current picture: LSK has just experienced an extremely strong breakout. Latest data puts LSK around $0.23–$0.25, while USDC remains essentially $1.00.
📈 Technical view
Trend: Strongly bullish in the short term.
Momentum: Extremely high — RSI is reported around 96, which means the move is severely overbought.
Volume: Explosive; reported 24h turnover is around $3.5B, with volume roughly 52× its normal level.
LSK moved from roughly $0.10 on Sept. 10 to above $0.25, so chasing the move carries substantial pullback risk.
🎯 Important levels
LevelImportance$0.26–0.27🔴 Major near-term resistance$0.30🔴 Psychological resistance$0.33–0.34🚀 Bullish breakout target$0.23–0.24🟢 First support$0.20–0.21🟢 Stronger support$0.18–0.19🟢 Critical pullback zone
A recent LSK trade signal had targets at $0.204, $0.215 and $0.23, all of which were reached; this confirms how rapidly the current move has developed.
🔥 My scenario
Bullish: If LSK holds $0.23–0.24 and breaks $0.26–0.27 with volume, I would watch $0.30 → $0.33/0.34 next.
Correction: Because RSI is around 96, a sharp retracement is very possible. A loss of $0.23 could send price toward $0.20–0.21. Losing $0.20 would weaken the immediate bullish structure.
Best approach: I would not chase a huge green candle here. A pullback/retest around $0.21–$0.24 with stabilization would offer a much cleaner risk/reward setup.
Overall: 🟢 Bullish trend / 🔴 extremely overbought. The trend favors buyers, but the probability of a violent correction is also elevated.
This is technical analysis, not financial advice. LSK is currently exceptionally volatile.
#ClarityActFacesProceduralVoteSept15 #US10YearTreasuryYieldNears5% #RevolutConfirmsFakeGovEmailDataBreach