


Pasqal stock exploded onto the Nasdaq this week after the business combination between Pasqal Holding SA and Bleichroeder Acquisition Corp. II closed. Shares opened at $16.98, hit $20.10 intraday, and settled at $19.11 on August 28. Volume surged to 3,649,400 shares, with roughly $360 million in cash secured at closing.
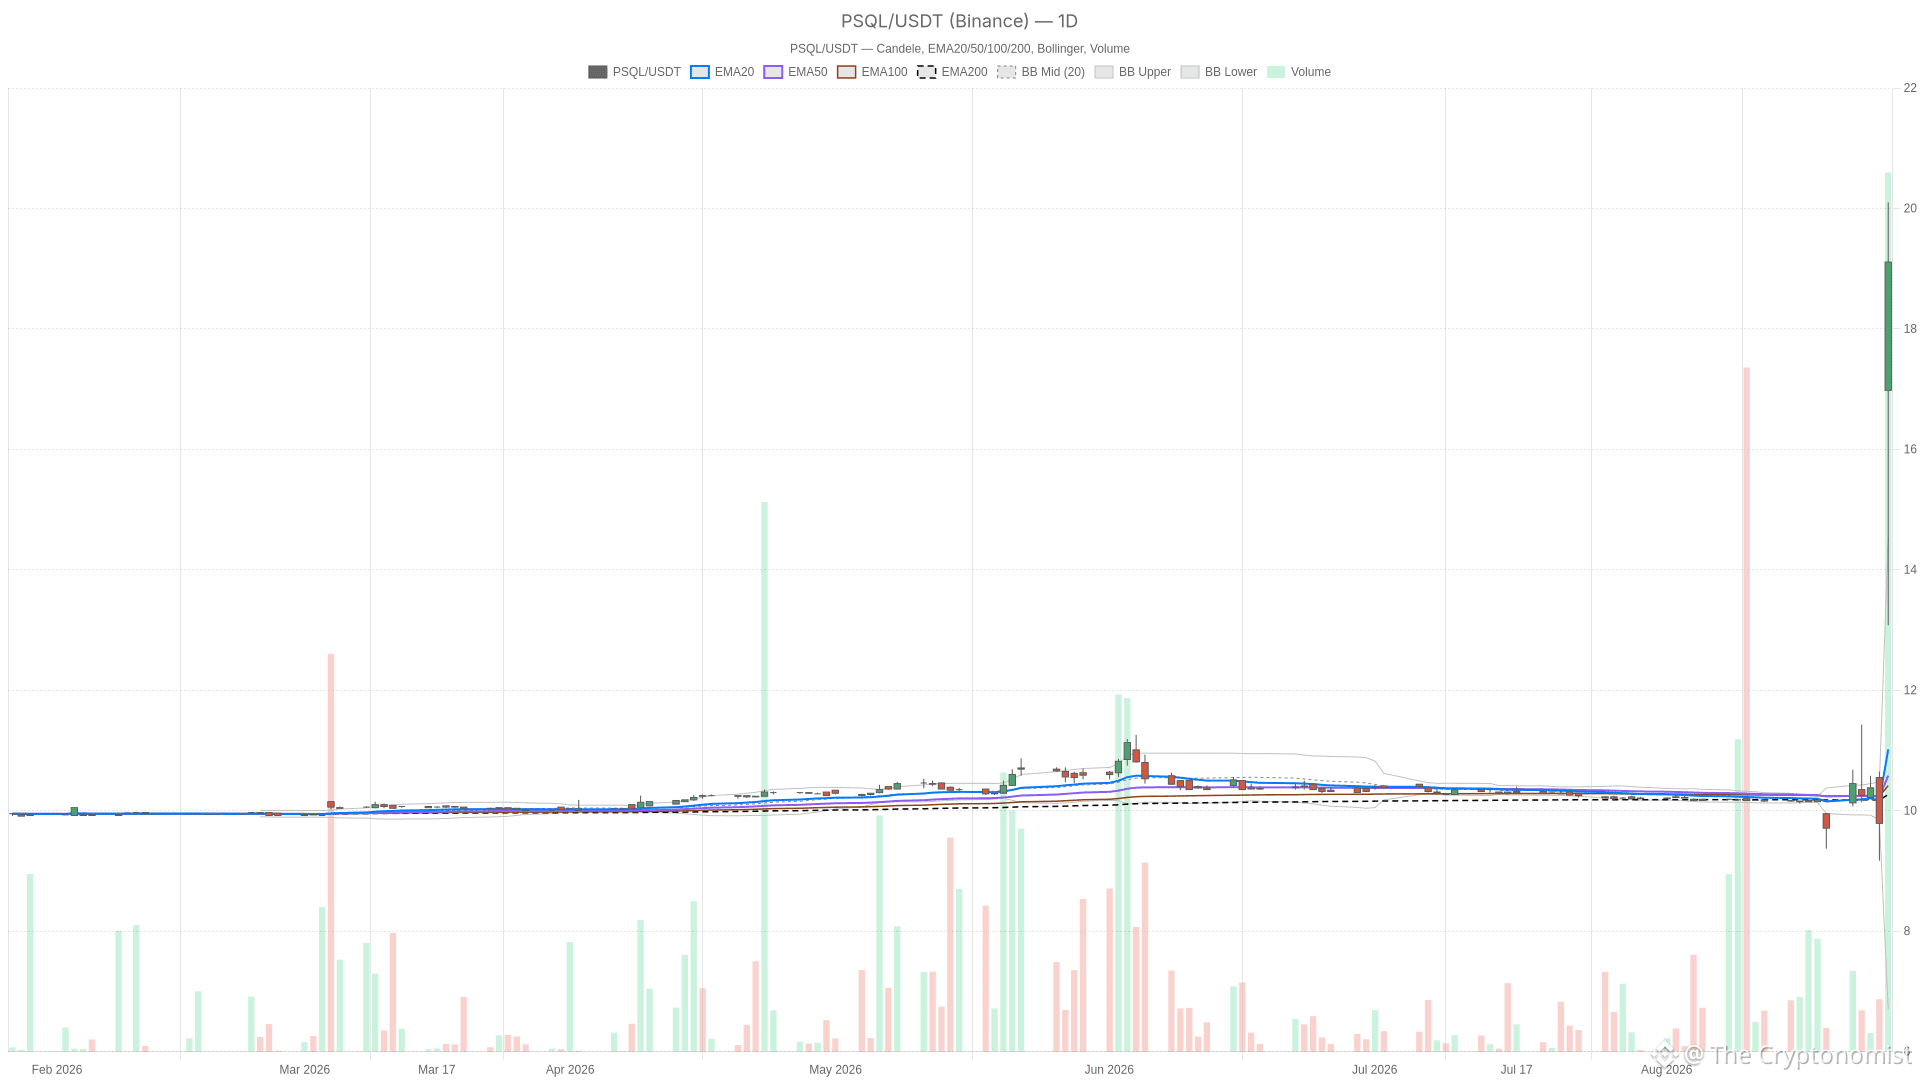 PSQL — daily chart with candlesticks, EMA20/EMA50 and volume.
Key takeaways
Pasqal stock closed at $19.11 on its Nasdaq debut day, August 28, after reaching an intraday high of $20.10.
Daily RSI14 hit 89.93, deep in overbought territory, reflecting aggressive buyer momentum since listing.
Volume exploded to 3,649,400 shares, signaling strong demand for the newly public quantum computing name.
The company secured roughly $360 million in cash at closing, funding global expansion plans.
Daily pivot support sits at 17.43, with resistance at $21.78 (R1) and support at $14.76 (S1).
Daily Chart: Pasqal Stock Enters Extreme Bullish Territory
The daily chart for Pasqal stock paints an unambiguously bullish picture. Price closed at $19.11, far above every major moving average.
Trend Structure and Momentum Alignment
On the daily timeframe, the regime reads unambiguously bullish. Price closed at $19.11, far above the 20-day EMA at $11.02, the 50-day EMA at $10.58, and the 200-day EMA at $10.27. That kind of separation is unusual. It reflects the shock of a fresh listing rather than a gradual trend build.
Meanwhile, RSI14 sits at 89.93, technically deep in overbought territory. However, for a stock just days into public trading, classic overbought readings carry less weight than usual. The number simply confirms how aggressively buyers have pushed price since the listing began.
MACD supports the bullish picture. The line at 0.68 sits well above the signal at 0.11, producing a histogram of 0.57. Momentum is clearly positive and still expanding.
Volatility Expansion and Range Boundaries
Bollinger Bands show the mid-line at 10.61, with the upper band at 14.52 and the lower band at 6.70. Friday’s close of 19.11 sits well outside the upper band. That is a volatility breakout signature, not a stable range trade.
ATR14 stands at 1.10, yet the daily range spanned from 13.08 to 20.10 — nearly seven points. That gap between the historical ATR and the realized range highlights how violently volatility has expanded since the listing. Pivot levels place the pivot point at 17.43, with resistance at $21.78 (R1) and support at $14.76 (S1). Closing above the pivot keeps the near-term bias tilted higher.
Hourly Chart Confirms Pasqal Stock Uptrend, With Less Extension
The 1-hour chart confirms the uptrend in Pasqal stock, though readings are less extreme than on the daily timeframe.
On the 1-hour timeframe, the picture stays bullish but less stretched. Price closed at 17.37 after opening at 14.88, with the high matching the close. EMA20 at 14.39, EMA50 at 13.98, and EMA200 at 13.72 remain properly stacked in bullish order. That confirms the uptrend across a shorter lookback.
MACD on this timeframe reads 0.49 against a signal of 0.22, for a histogram of 0.26. It is positive, though less extreme than the daily reading. Pivot analysis shows pp at 16.31, r1 at 18.43, and s1 at 15.26. Price trading above pivot and pushing toward r1 keeps buyers in control intraday.
Therefore, the hourly timeframe confirms the daily bias without contradicting it. The trend structure lines up cleanly here, even if the extension versus daily looks less dramatic.
15-Minute Chart Shows Pasqal Stock Consolidation After the Spike
The 15-minute chart for Pasqal stock reads neutral, contrasting with the bullish readings on higher timeframes.
Short-Term Structure Still Resetting
On the shortest timeframe, the picture turns more nuanced. The 15-minute regime reads neutral, in contrast to the bullish readings on daily and hourly. EMA20 at 14.90 sits below EMA50 at 15.10 and EMA200 at 15.47 — an inverted stack. That reflects the choppy price action just before the breakout accelerated. Price has since closed at 17.37, well above all three EMAs. Short-term structure simply hasn’t fully caught up with the sharp move higher.
Meanwhile, RSI14 on the 15-minute chart reads 64.41, a moderate level, notably far from the extreme overbought condition seen on daily. MACD line at 0.03 versus signal at -0.21 shows a fresh, early-stage bullish crossover, with the histogram at 0.25.
Intraday Extension and Pivot Context
Bollinger Bands here show mid at 14.87, upper at 16.69, and lower at 13.05. The close at 17.37 sits above the upper band, signaling short-term overextension on this timeframe as well. ATR14 at 0.79 confirms elevated intraday volatility. Pivot levels put pp at 16.64, r1 at 18.10, and s1 at 15.91. Price trading between pivot and r1 leaves room before the next resistance test.
Overall, the 15-minute conflict is not a bearish signal. Instead, it shows that short-term structure is still resetting after an aggressive breakout spike. That is common after news-driven moves of this size.
Bullish Scenario for Pasqal Stock
The bullish scenario for Pasqal stock hinges on buyers maintaining control above the daily pivot at 17.43.
If buyers keep control, Pasqal stock could extend toward the daily R1 level at $21.78. Sustained daily closes above the daily pivot at 17.43 would support that continuation. A confirmed bullish crossover on the 15-minute MACD would help legitimize short-term structure. This should combine with EMA20 climbing back above EMA50 and EMA200. Meanwhile, absorption of the overbought RSI condition through sideways consolidation would be healthier than a sharp reversal. That pattern would signal continuation rather than exhaustion.
Bearish Scenario for Pasqal Stock and What Would Invalidate It
The bearish case for Pasqal stock centers on elevated reversal risk driven by extreme overbought conditions across daily timeframes.
On the other hand, a stock this extended above its long-term averages carries real reversal risk. A daily close back below the pivot at 17.43, or a break of the S1 level at $14.76, would weaken the bullish case meaningfully. On the hourly chart, a drop below the EMA20 at 14.39 would be an early warning sign of fading momentum. The RSI14 reading sits near 90 on the daily chart. Any sharp reversal candle could trigger fast profit-taking, especially from short-term traders who entered near the highs.
Overall, Pasqal stock is trading in a state of extreme momentum following its Nasdaq debut. Daily and hourly timeframes remain aligned bullish. The 15-minute chart is still digesting the size of the initial move. Volatility stays elevated across every timeframe. With such a fresh listing, price discovery is still ongoing. Positioning here carries above-average risk. Both the overbought daily RSI and the extended Bollinger Band condition point to elevated near-term uncertainty.
FAQ
What price did Pasqal stock close at on its Nasdaq debut?
Pasqal stock closed at $19.11 on August 28, after opening at $16.98 and reaching an intraday high of $20.10.
Is Pasqal stock overbought after its listing?
The daily RSI14 reads 89.93, which is technically deep in overbought territory. However, for a stock just days into public trading, classic overbought readings carry less weight than usual.
What are the key support and resistance levels for Pasqal stock?
On the daily timeframe, the pivot point sits at 17.43, with R1 resistance at $21.78 and S1 support at $14.76. On the hourly chart, EMA20 at 14.39 serves as an early warning level for fading momentum.
How much cash did Pasqal secure from the business combination?
Pasqal secured roughly $360 million in cash at the closing of the business combination with Bleichroeder Acquisition Corp. II, providing capital for global expansion.
Disclaimer: This article is for informational purposes only and does not constitute financial advice, an investment recommendation, or a solicitation to buy or sell any financial instrument or cryptocurrency. The analysis provided is not indicative of future results. Investing in crypto assets and financial markets carries a high risk of capital loss. Always do your own research (DYOR) and consult a qualified financial advisor before making any decision.
Article produced with the assistance of artificial intelligence and reviewed by the editorial team.