
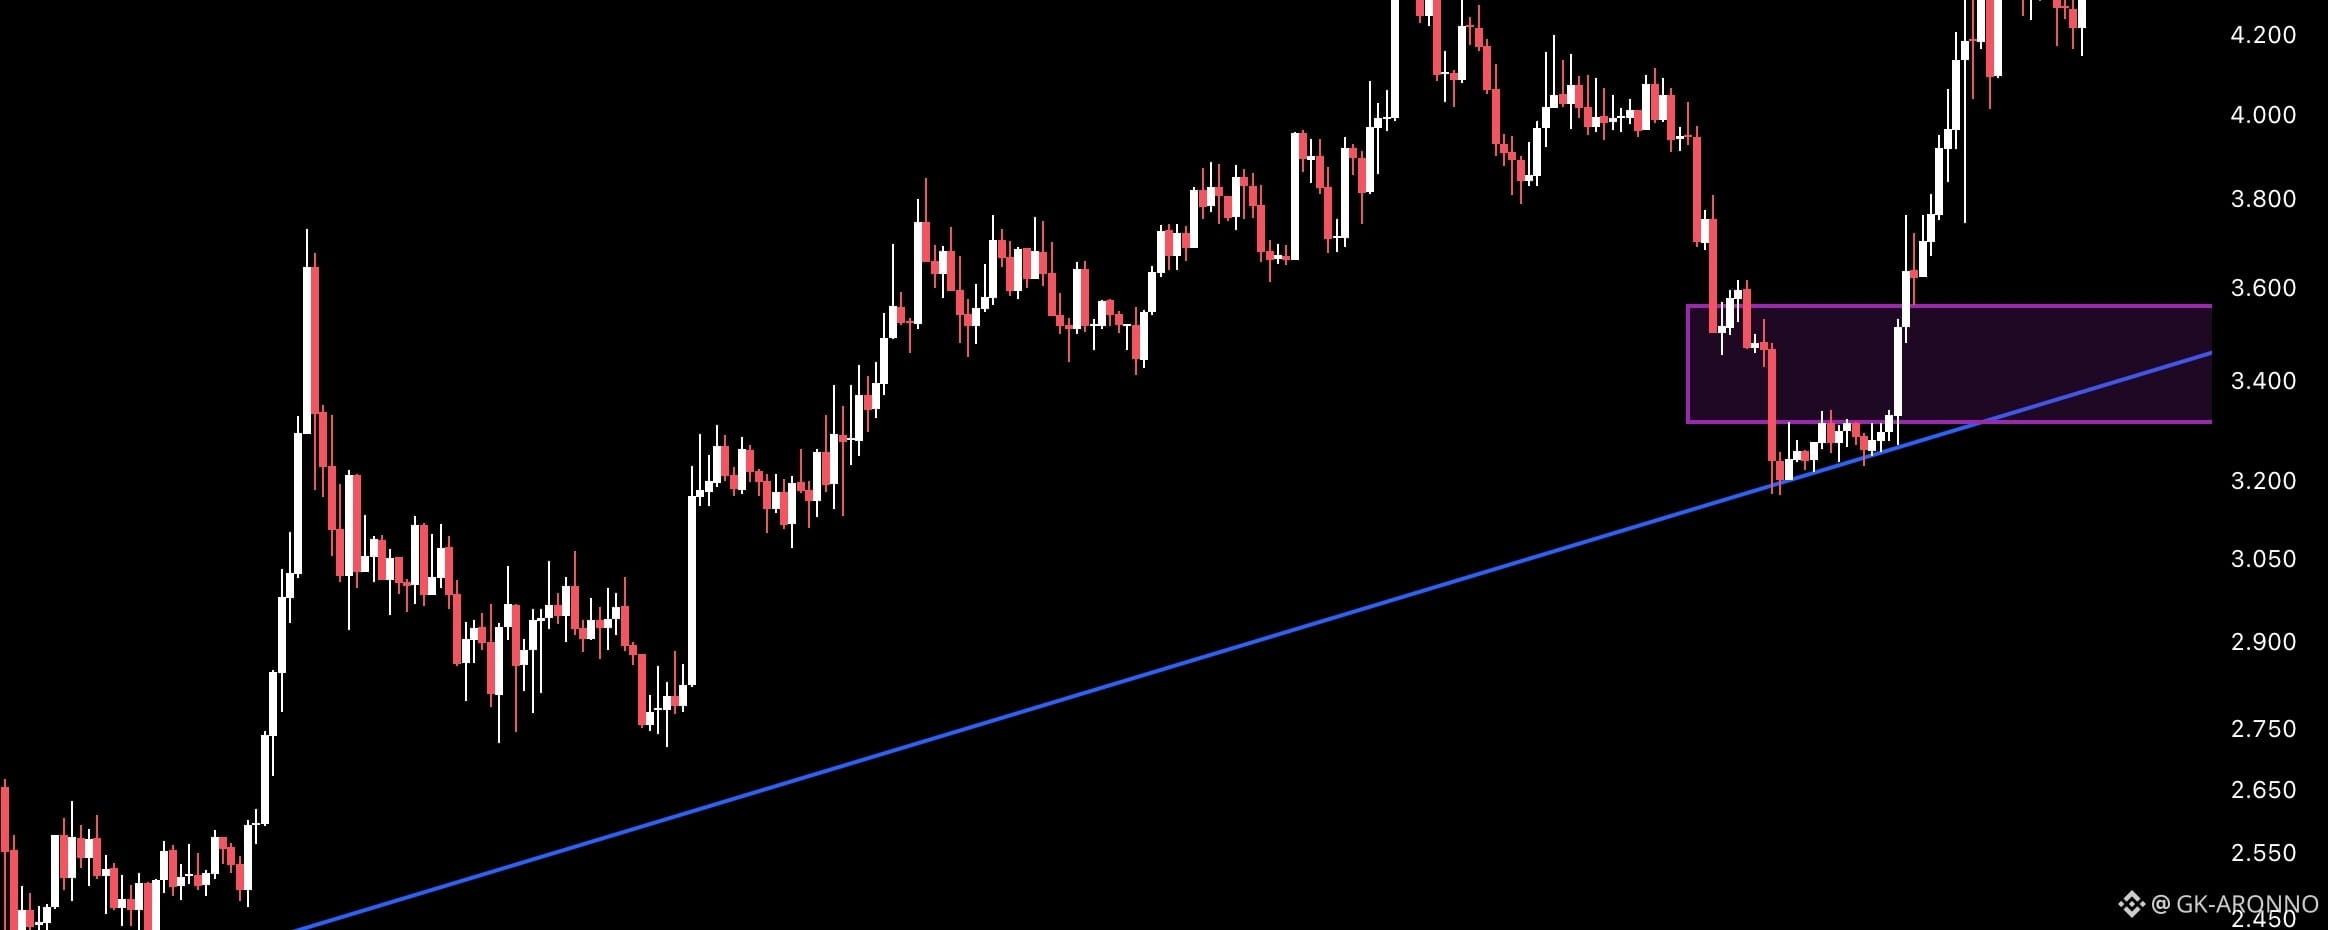


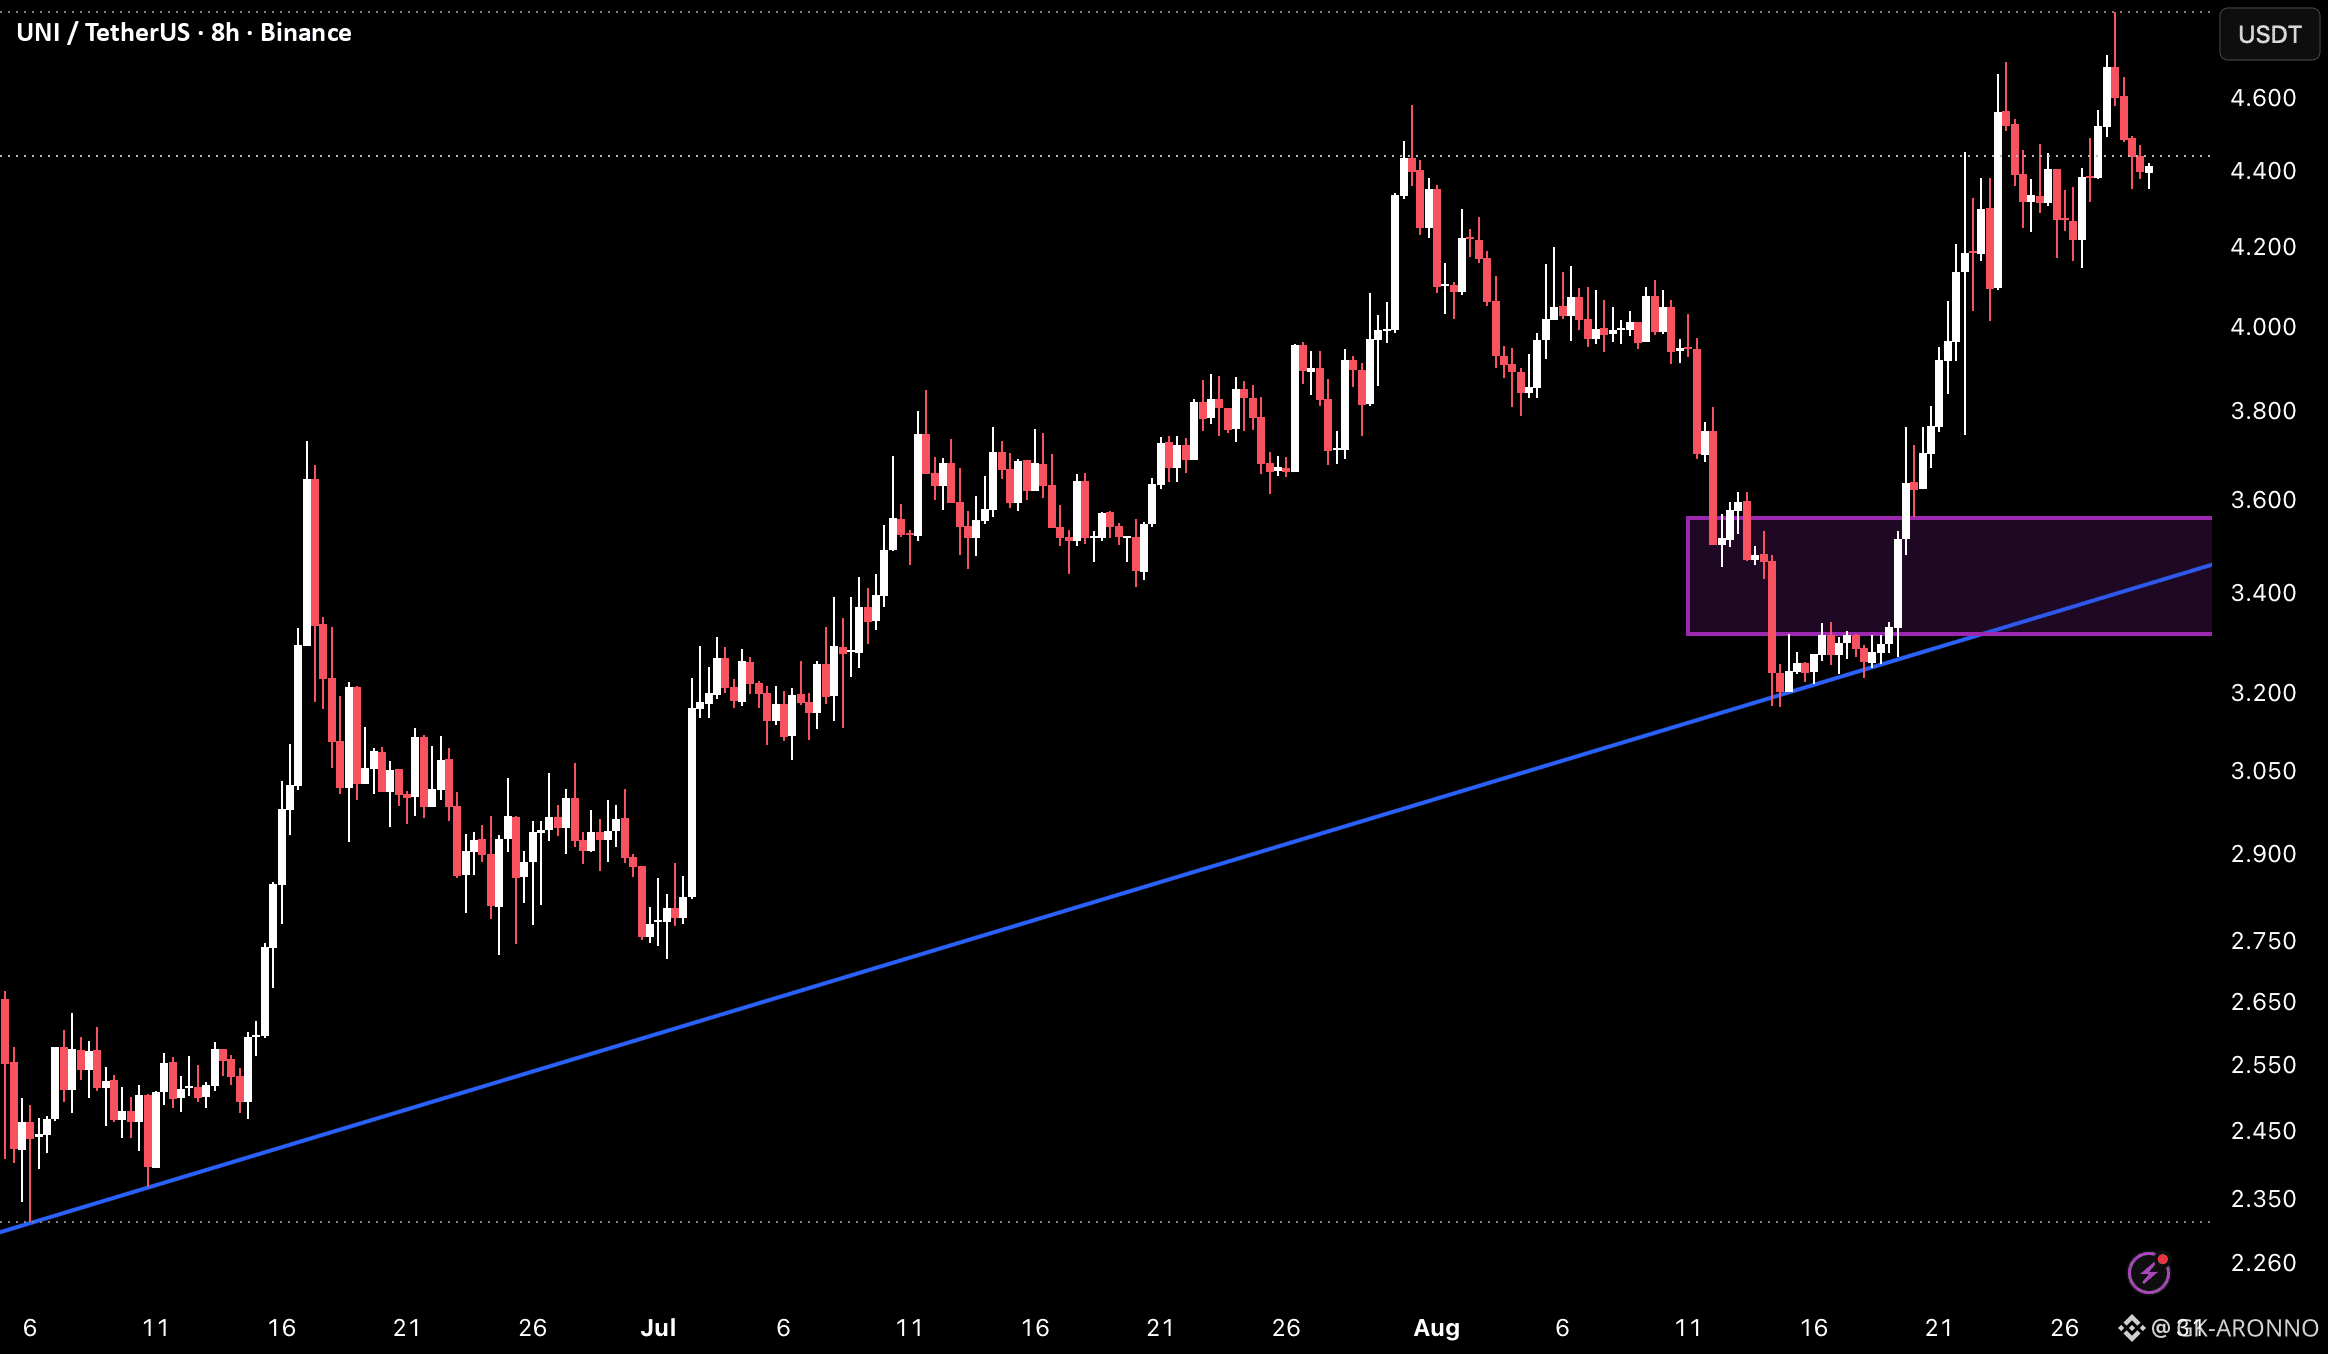
UNI on the 8H timeframe is currently trading around 4.410 after bouncing sharply from the demand zone and rising trendline near 3.200–3.400 on August 12 and recovering all the way back to the prior high region near 4.400–4.600, with price now consolidating just below the prior August high as the second test of that resistance zone.
The chart shows a rising trendline originating from the early June low near 2.350, connecting the June 19 low near 2.400 and continuing to climb into the 3.200–3.350 area currently. Price rallied from that trendline into the August 5 high near 4.600 before pulling back sharply into the demand zone visible on the chart near 3.200–3.400, where the rising trendline provided confluence support and the recovery launched. That pullback to the demand zone and trendline on August 11–14 was the deepest retracement since the June rally began and is the same setup covered in the prior idea, which reached all targets. Price has now recovered the entire pullback and is pressing back into the 4.400–4.600 prior high region for a second test, with the demand zone and rising trendline sitting well below as the macro support floor.
All targets from the prior trendline and demand zone bounce have been reached, with price back at the prior high region that previously produced the pullback to the demand zone, making the current level the key structural decision point for what comes next.
Key Levels To Watch
→ 4.500–4.600 Prior August high, major resistance above
→ 4.200–4.400 Current consolidation zone, support above demand
→ 3.940–4.000 Horizontal pivot, prior breakout level
→ 3.600–3.700 Minor support, post-recovery reference
→ 3.200–3.400 Demand zone, key support on pullback
→ 3.050–3.200 Rising trendline overlap, secondary support (dynamic)
→ Below 2.900 Trendline breakdown, macro structure at risk
A confirmed 8H close above 4.500–4.600 would clear the prior August high and open upside above the structure visible on this chart, with no resistance overhead and the rising trendline continuing to support from well below.
A rejection at 4.400–4.600 and a pullback toward 3.940–4.000 would be a normal consolidation following the recovery, and a loss of 3.600–3.700 would bring the demand zone near 3.200–3.400 back into focus as the next key test on a deeper correction.
Prior demand zone bounce reached all targets, price back at resistance. Break above 4.500–4.600 → new highs, upside open. Reject here → consolidation, demand zone near 3.200–3.400 the key on a deeper pullback. Bias bullish above rising trendline. Shift only on confirmed close below 3.200–3.400 demand zone.
