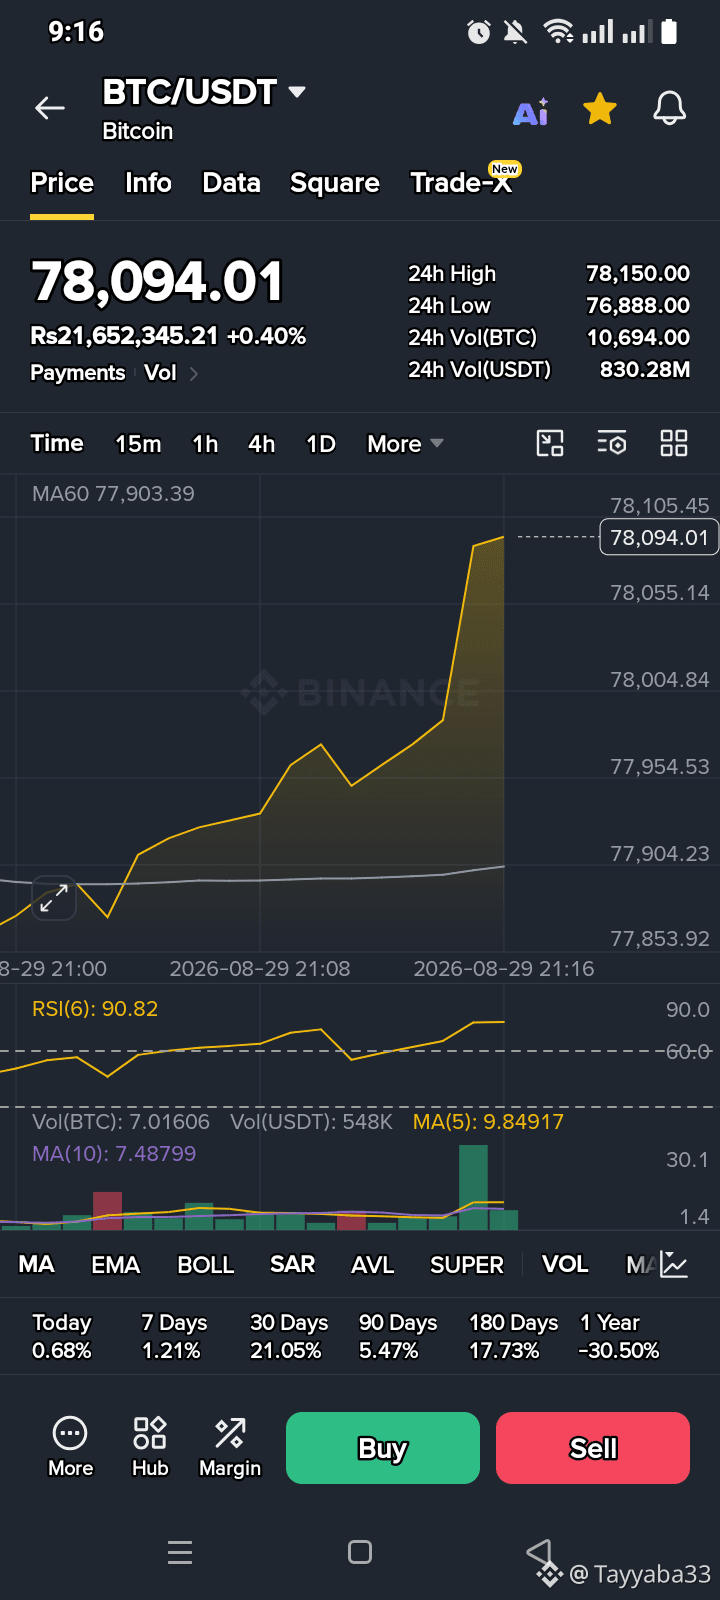
$BTC/USDT chart is showing a strong short-term bullish move, but there is also a warning that BTC may be overbought.
📊 What the chart tells us
Current price: around $78,094
24h high: $78,150
24h low: $76,888
Price is above MA60: MA60 is around $77,903, which supports the bullish trend.
RSI(6): 90.82 → this is very overbought. It means BTC has risen very quickly and a short-term pullback/correction is possible.
The recent candles/price movement show strong upward momentum.
Volume increased sharply during the latest upward move, which confirms that there was strong buying activity.
⚠️ Important part
Because RSI is 90+, I would not chase a buy immediately just because the price is going up. #BTC could continue higher, but it could also pull back to retest lower levels.
Possible areas to watch from this chart:
$78,150 → immediate resistance / 24h high
$77,900 → around MA60, important support
$77,950–$78,000 → nearby area to watch if price pulls back
Simple conclusion: 🟢 Trend = bullish, 🔥 momentum = very strong, ⚠️ RSI = extremely overbought. So waiting for a pullback/confirmation may be safer than entering after this sudden jump.
#BTC走势分析 #UpdateBTC #latestupdate
📊 What the chart tells us
Current price: around $78,094
24h high: $78,150
24h low: $76,888
Price is above MA60: MA60 is around $77,903, which supports the bullish trend.
RSI(6): 90.82 → this is very overbought. It means BTC has risen very quickly and a short-term pullback/correction is possible.
The recent candles/price movement show strong upward momentum.
Volume increased sharply during the latest upward move, which confirms that there was strong buying activity.
⚠️ Important part
Because RSI is 90+, I would not chase a buy immediately just because the price is going up. #BTC could continue higher, but it could also pull back to retest lower levels.
Possible areas to watch from this chart:
$78,150 → immediate resistance / 24h high
$77,900 → around MA60, important support
$77,950–$78,000 → nearby area to watch if price pulls back
Simple conclusion: 🟢 Trend = bullish, 🔥 momentum = very strong, ⚠️ RSI = extremely overbought. So waiting for a pullback/confirmation may be safer than entering after this sudden jump.
#BTC走势分析 #UpdateBTC #latestupdate