


BTC just experienced a sharp drop from its local high of $80,000+ down to the $77,400 zone. Is the bullish trend officially broken? Let's break down the multi-timeframe analysis to get a clear picture.
📌 1. M5 Timeframe (Scalp/Short-term): Minor Support Broken & Aggressive Selling
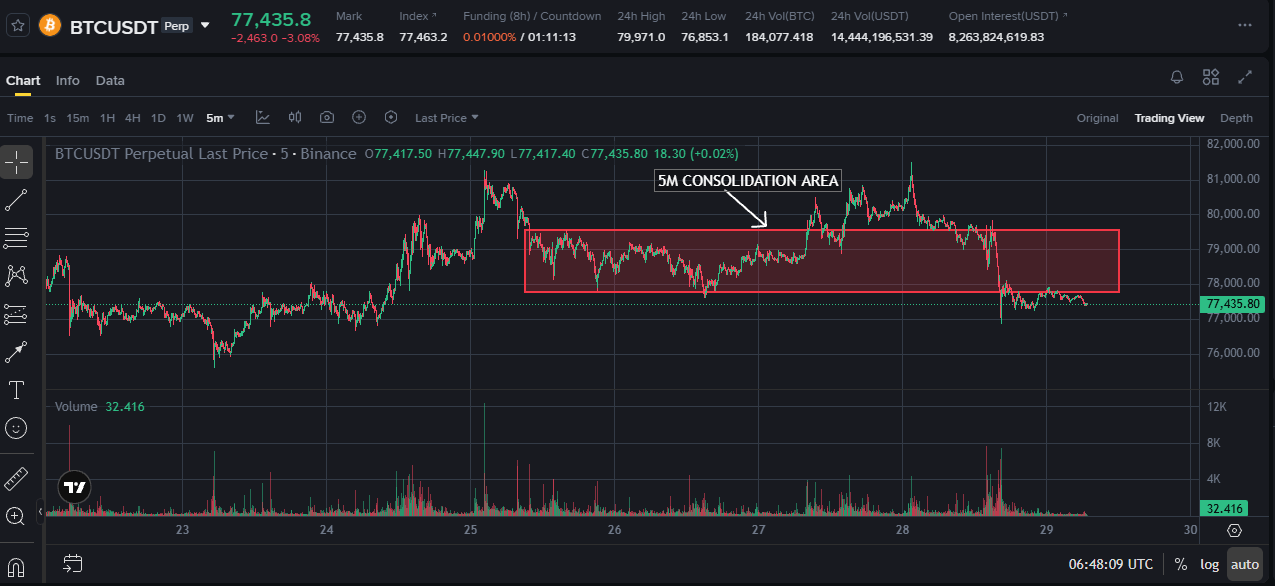
Current Structure: Price broke below the $77,800 – $79,500 consolidation zone with a decisive red candle.
Volume: Sell volume spiked significantly on M5, indicating aggressive short-term profit-taking and liquidity hunting.
M5 Verdict: Micro-bullish structure is broken. Price is currently in a minor technical bounce/consolidation phase searching for a temporary bottom.
📌 2. H1 Timeframe (Mid-term): Market Structure Intact – Healthy Re-test
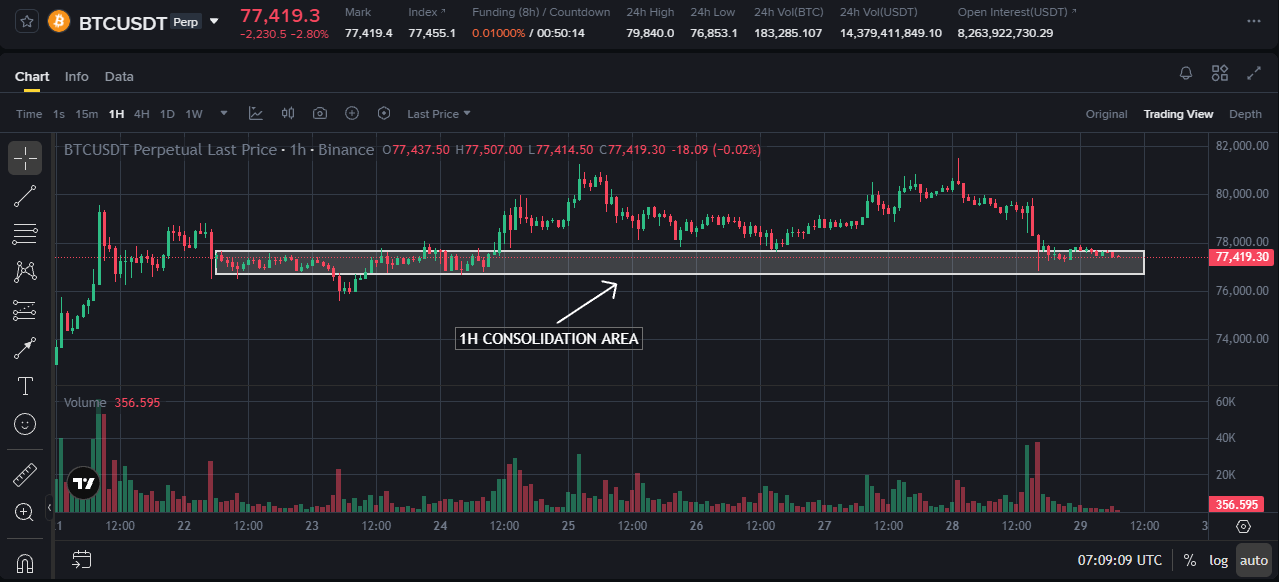
Current Structure: Looking at H1, BTC recently launched a strong impulsive move from $64k–$68k straight up to $81k+. The current pull-back to $77,419 is simply a technical re-test.
Key Support Zone: Crucial demand area sits at $76,800 – $77,800 (previous local resistance). Price remains above this key boundary, keeping the higher-low structure intact.
Volume: Compared to the explosive buy volume during the breakout, the sell volume on H1 is noticeably lower ➔ No signs of mass panic selling from bulls yet.
🎯 SCENARIOS & GAME PLAN
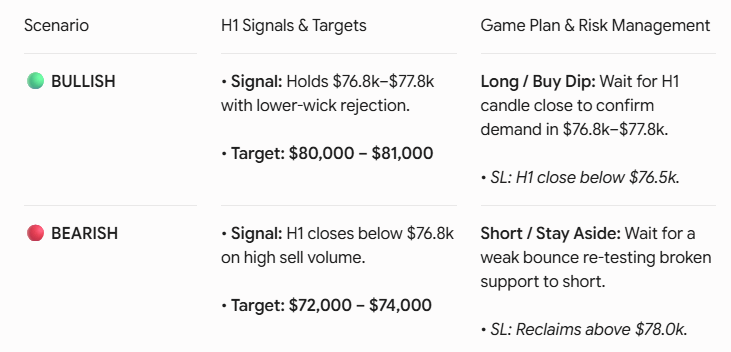
💡 Quick Reference:
Key Support (H1): $76,800 – $77,800 (Macro trend boundary).
Minor Resistance (M5): $77,800 – $79,500 (Broken consolidation zone).
