🚀 AERO IS APPROACHING A MAJOR BREAKOUT ZONE
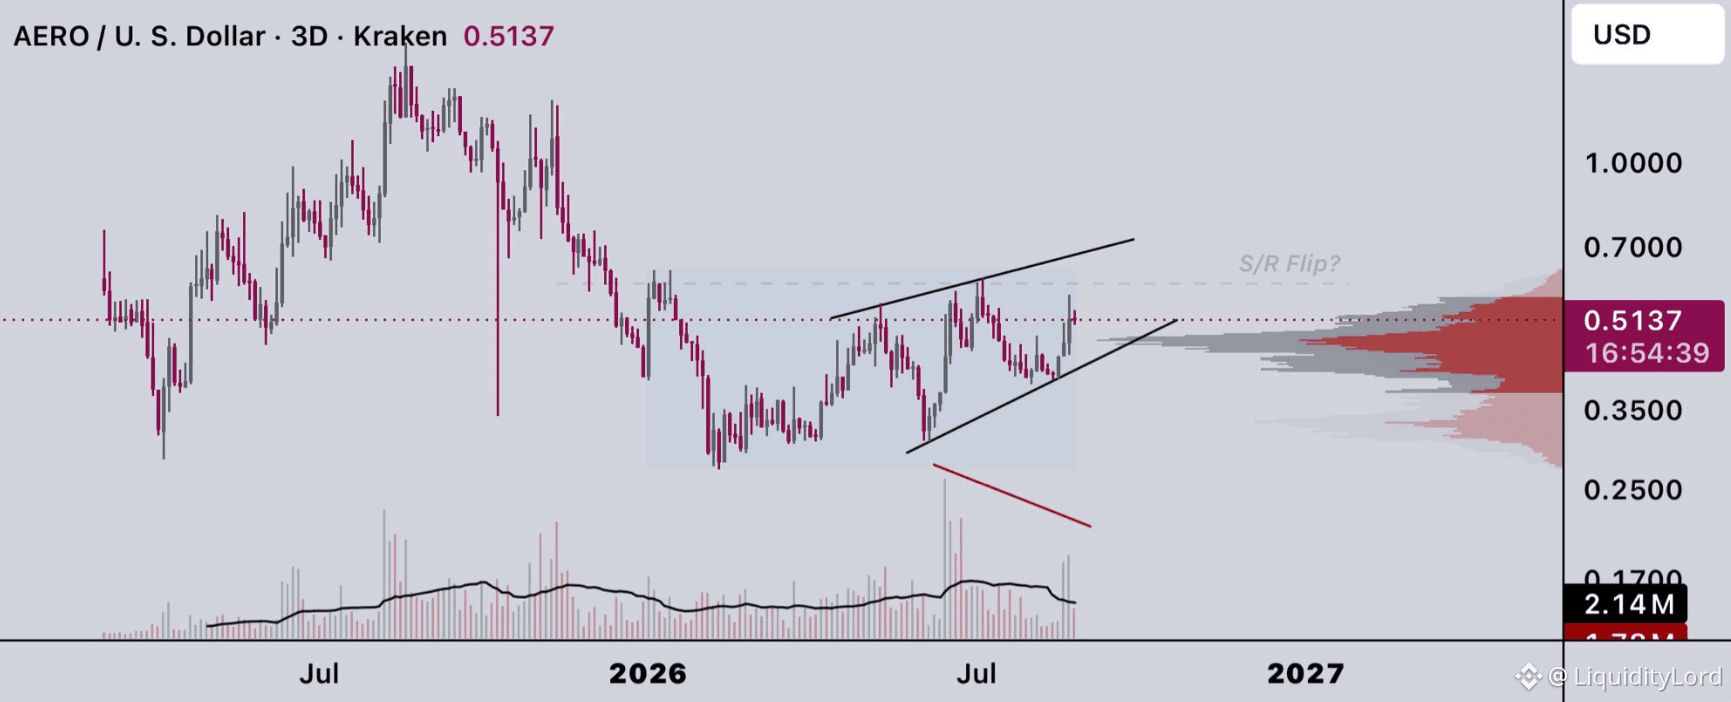
AERO trades near 0.514 on the 3D chart after recovering from 0.30. Price has been building a rising structure while repeatedly testing the upper boundary.
📊 STRUCTURE CHECK
The chart shows compression between rising support and descending resistance. Buyers have defended the lower trendline several times, while rallies continue to face supply around 0.55-0.60.
Price is now pressing the upper half of the structure. A confirmed breakout above descending resistance would strengthen the bullish scenario and could turn resistance into support.
🎯 TARGET MAP
TP1: 0.60
TP2: 0.70
TP3: 1.00
SL: 0.35
TP1 is the first breakout checkpoint near the upper resistance area. TP2 represents the next expansion level, while TP3 targets the major psychological zone.
⚠ INVALIDATION
The setup weakens if AERO loses the rising trendline and fails to recover support. A sustained move below 0.35 would invalidate the bullish structure.
🧩 EXECUTION FLOW
STONfi is relevant to execution, not the AERO thesis. During a breakout, liquidity can become fragmented as traders reposition and available depth changes.
STONfi uses RFQ-based routing, allowing competing resolvers to search fragmented liquidity and provide competitive swap quotes. This can be useful when spreads and available liquidity change quickly during volatile conditions.
🔎 MARKET VIEW
I would watch 0.55-0.60 closely. A clean breakout and successful retest would strengthen the path toward 0.70 and potentially 1.00. If rising support fails, I would wait for a new structure rather than chase the move.
Confirmation above the trendline is essential.
NFA - DYOR
$AERO
AERO trades near 0.514 on the 3D chart after recovering from 0.30. Price has been building a rising structure while repeatedly testing the upper boundary.
📊 STRUCTURE CHECK
The chart shows compression between rising support and descending resistance. Buyers have defended the lower trendline several times, while rallies continue to face supply around 0.55-0.60.
Price is now pressing the upper half of the structure. A confirmed breakout above descending resistance would strengthen the bullish scenario and could turn resistance into support.
🎯 TARGET MAP
TP1: 0.60
TP2: 0.70
TP3: 1.00
SL: 0.35
TP1 is the first breakout checkpoint near the upper resistance area. TP2 represents the next expansion level, while TP3 targets the major psychological zone.
⚠ INVALIDATION
The setup weakens if AERO loses the rising trendline and fails to recover support. A sustained move below 0.35 would invalidate the bullish structure.
🧩 EXECUTION FLOW
STONfi is relevant to execution, not the AERO thesis. During a breakout, liquidity can become fragmented as traders reposition and available depth changes.
STONfi uses RFQ-based routing, allowing competing resolvers to search fragmented liquidity and provide competitive swap quotes. This can be useful when spreads and available liquidity change quickly during volatile conditions.
🔎 MARKET VIEW
I would watch 0.55-0.60 closely. A clean breakout and successful retest would strengthen the path toward 0.70 and potentially 1.00. If rising support fails, I would wait for a new structure rather than chase the move.
Confirmation above the trendline is essential.
NFA - DYOR
$AERO