CHAINLINK IS APPROACHING A MAJOR BREAKOUT ZONE
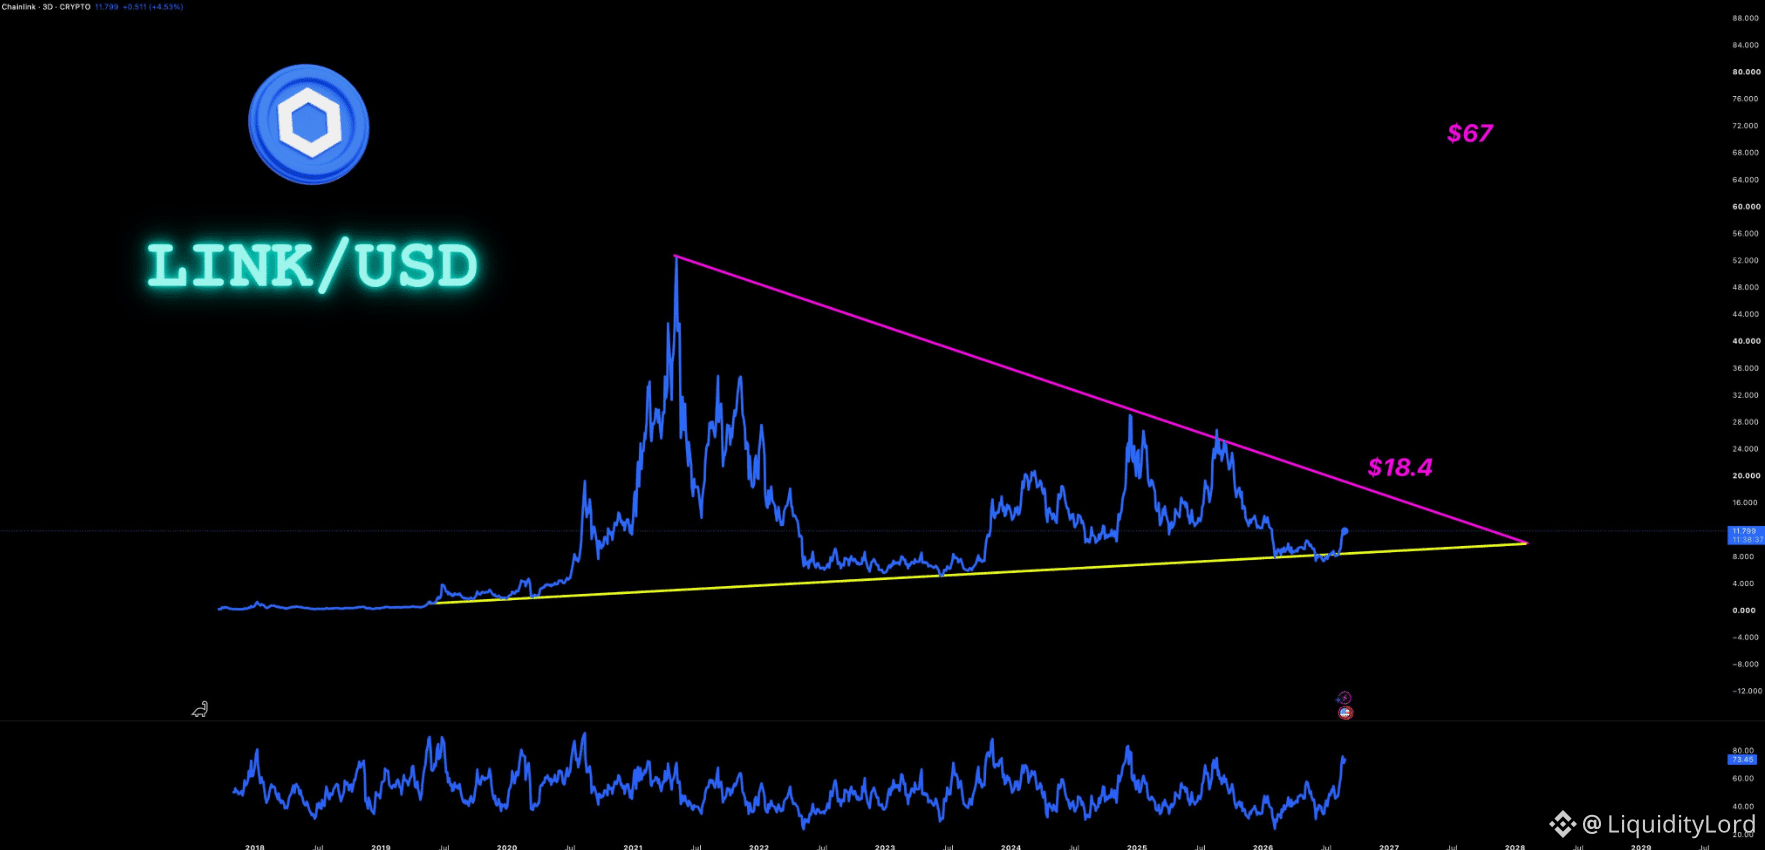
LINK trades near 11.8 on the 3D chart. Price is holding the rising lower trendline while descending resistance from the 2021 peak.
📊 STRUCTURE CHECK
The chart shows a large symmetrical triangle. The upper trendline rejects rallies, while the lower boundary provides support. The repeated tests of both boundaries make this zone especially important for the next directional move. If buyers can reclaim the resistance and hold it as support, the long-term compression could begin resolving to the upside.
LINK is now near the lower part of this structure. A clean breakout above descending resistance would be the key confirmation. The first key resistance is around 18.4 now.
🎯 TARGET MAP
TP1: 18.4
TP2: 30.0
TP3: 67.0
SL: 8.00
TP1 is the first breakout checkpoint. TP2 is the next expansion area, while TP3 is the broader target.
⚠ INVALIDATION
The setup weakens if LINK loses rising support and falls below the lower boundary. A sustained break under 8.00 would damage the structure.
A wick above resistance is not enough. Buyers need acceptance above the descending trendline.
🧩 EXECUTION FLOW
STONfi is relevant to execution, not the LINK thesis. During breakouts, liquidity can fragment and spreads can shift quickly.
STONfi uses RFQ-based routing, allowing competing resolvers to search fragmented liquidity and provide competitive swap quotes. This can help navigate changing liquidity conditions.
The distinction is simple: LINK price action defines the thesis, while STONfi focuses on swap execution. Routing does not predict direction, but liquidity discovery matters during volatility now.
🔎 MARKET VIEW
I would watch the descending trendline closely. A confirmed breakout would put 18.4 first, followed by 30.0 and potentially 67.0. Until then, the triangle remains compression, not a confirmed breakout.
NFA - DYOR
$LINK
LINK trades near 11.8 on the 3D chart. Price is holding the rising lower trendline while descending resistance from the 2021 peak.
📊 STRUCTURE CHECK
The chart shows a large symmetrical triangle. The upper trendline rejects rallies, while the lower boundary provides support. The repeated tests of both boundaries make this zone especially important for the next directional move. If buyers can reclaim the resistance and hold it as support, the long-term compression could begin resolving to the upside.
LINK is now near the lower part of this structure. A clean breakout above descending resistance would be the key confirmation. The first key resistance is around 18.4 now.
🎯 TARGET MAP
TP1: 18.4
TP2: 30.0
TP3: 67.0
SL: 8.00
TP1 is the first breakout checkpoint. TP2 is the next expansion area, while TP3 is the broader target.
⚠ INVALIDATION
The setup weakens if LINK loses rising support and falls below the lower boundary. A sustained break under 8.00 would damage the structure.
A wick above resistance is not enough. Buyers need acceptance above the descending trendline.
🧩 EXECUTION FLOW
STONfi is relevant to execution, not the LINK thesis. During breakouts, liquidity can fragment and spreads can shift quickly.
STONfi uses RFQ-based routing, allowing competing resolvers to search fragmented liquidity and provide competitive swap quotes. This can help navigate changing liquidity conditions.
The distinction is simple: LINK price action defines the thesis, while STONfi focuses on swap execution. Routing does not predict direction, but liquidity discovery matters during volatility now.
🔎 MARKET VIEW
I would watch the descending trendline closely. A confirmed breakout would put 18.4 first, followed by 30.0 and potentially 67.0. Until then, the triangle remains compression, not a confirmed breakout.
NFA - DYOR
$LINK