
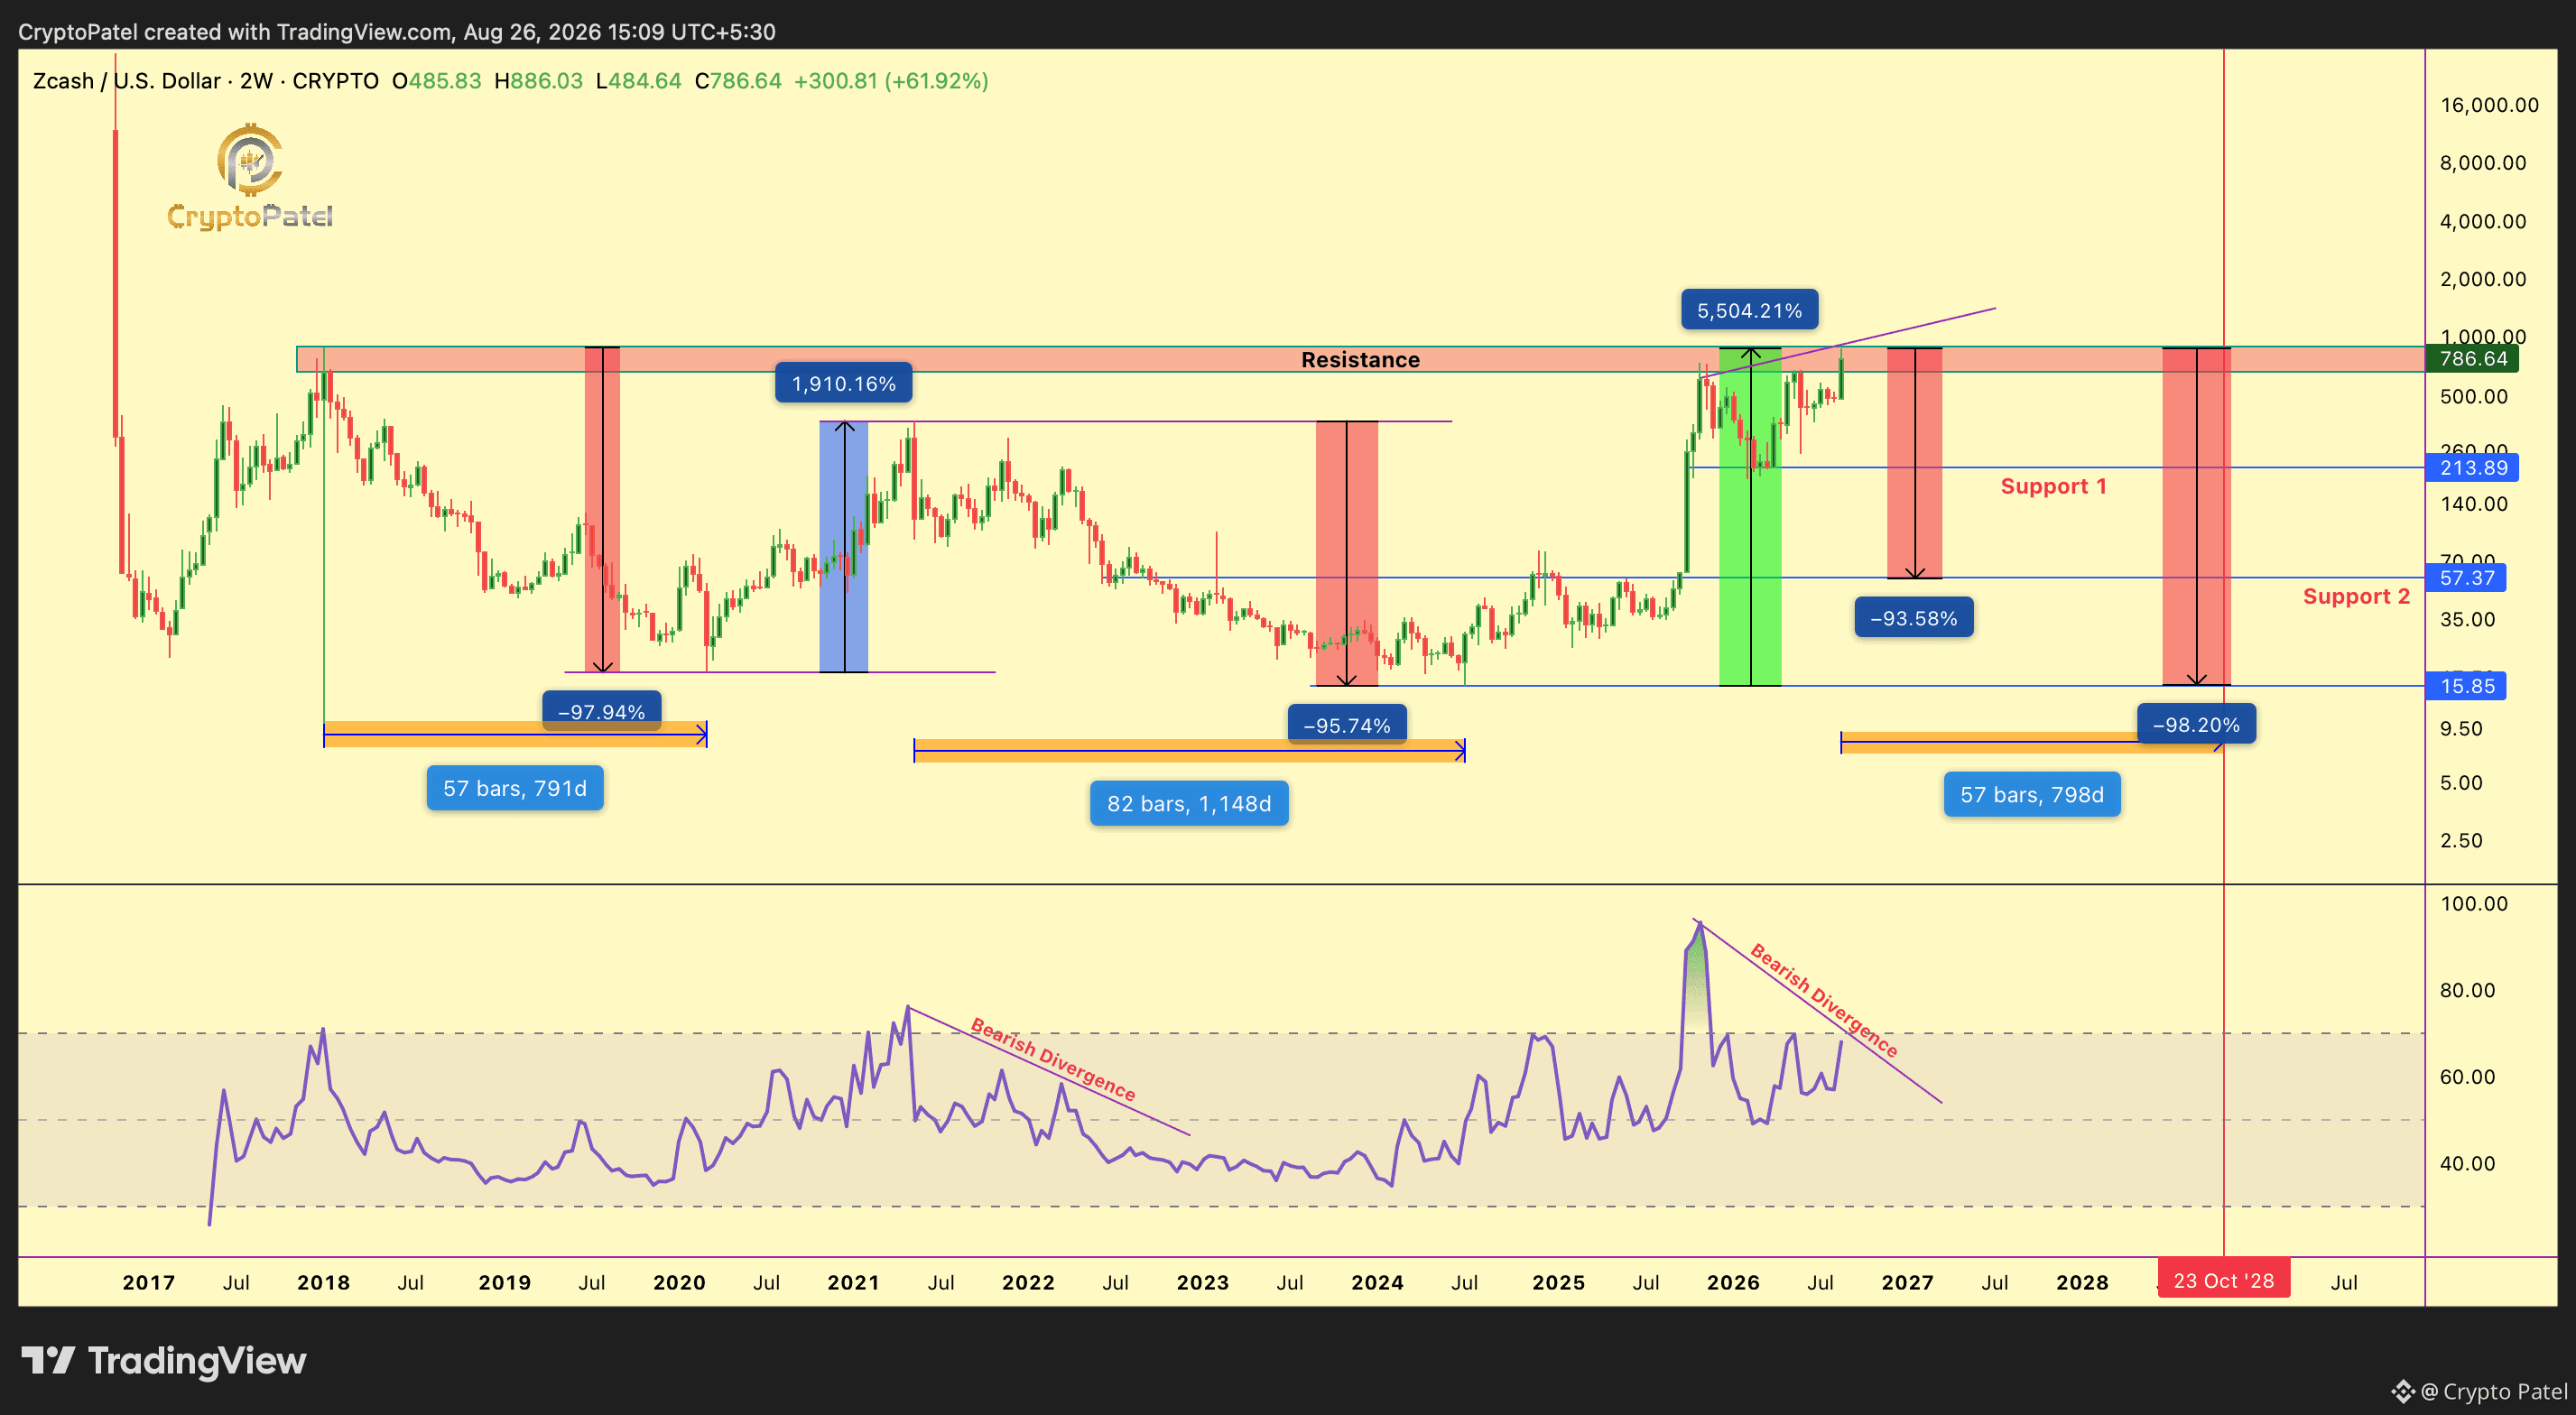
$ZEC : A 2W Structural Breakout Or Another 98% Distribution Cycle? The Full #ZEC Chart Shows A Clear Repeating Structure: 1️⃣ 2017–2018: $22 → $900 = ~4,000% Rally ➡️ Then Distribution: $900 → $18.50 = ~98% Crash 2️⃣ 2020–2021: $18.50 → $372 = ~1,900% Rally ➡️ Then Distribution: $372 → $15.85 = ~96% Crash 3️⃣ Current Cycle: Accumulation Started Near $15.85 In July 2024. ➡️ Since Then, ZEC/USDT Has Exploded Toward $888+ And Now Trades Near ATH. The Timing Matters. 🇺🇸 Grayscale's Spot Zcash ETF Started Trading On NYSE Arca On August 25. The Major News Is No Longer A Rumour, It Is Already Live. And This Is Where I Become Cautious. “Buy The Rumour, Sell The News.” Price Is Near A Major Historical Resistance Zone Around $800–$900, While RSI Is Showing Bearish Divergence And Not Confirming The Strength Of This Pump. I Am NOT Saying ZECUSDT Cannot Go Higher. But Based On Its Historical Cycle Behaviour, I Believe Downside Risk Is Much Higher Than The Upside Risk At $800–$900. My Strategy: ❌ I Am Not Buying ZEC At $800–$900 Or Chasing Higher. 🔻 I Am Watching For Confirmed Short Opportunities. ▶️ Long-Term, I Am Watching The $50–$100 Zone For Potential Accumulation Over The Next 1–3 Years. If $900 Breaks, Holds, And Converts Into Support, I Will Reassess. Until Then, I Prefer Capital Protection Over FOMO. Ask Yourself: Would You Rather Buy ZEC At $900 After A Massive Expansion Or Accumulate It Under $20 Like The Previous Cycle? Think About The Risk/Reward Before You Click Buy. Trade The Structure. Not The Hype.

Đăng
Tuyên bố miễn trừ trách nhiệm: Nội dung bao gồm cả quan điểm của bên thứ ba, không phải lời khuyên. Có thể sử dụng nội dung do Binance Ai đưa ra nhưng không được đảm bảo. Xem Điều khoản & Điều kiện.