Binance Square
Mr Hani 76
41 Bài đăng

Mr Hani 76

Always doing hard work.
7 Đang theo dõi
1 Người theo dõi
5 Đã thích
Bài đăng
·
--
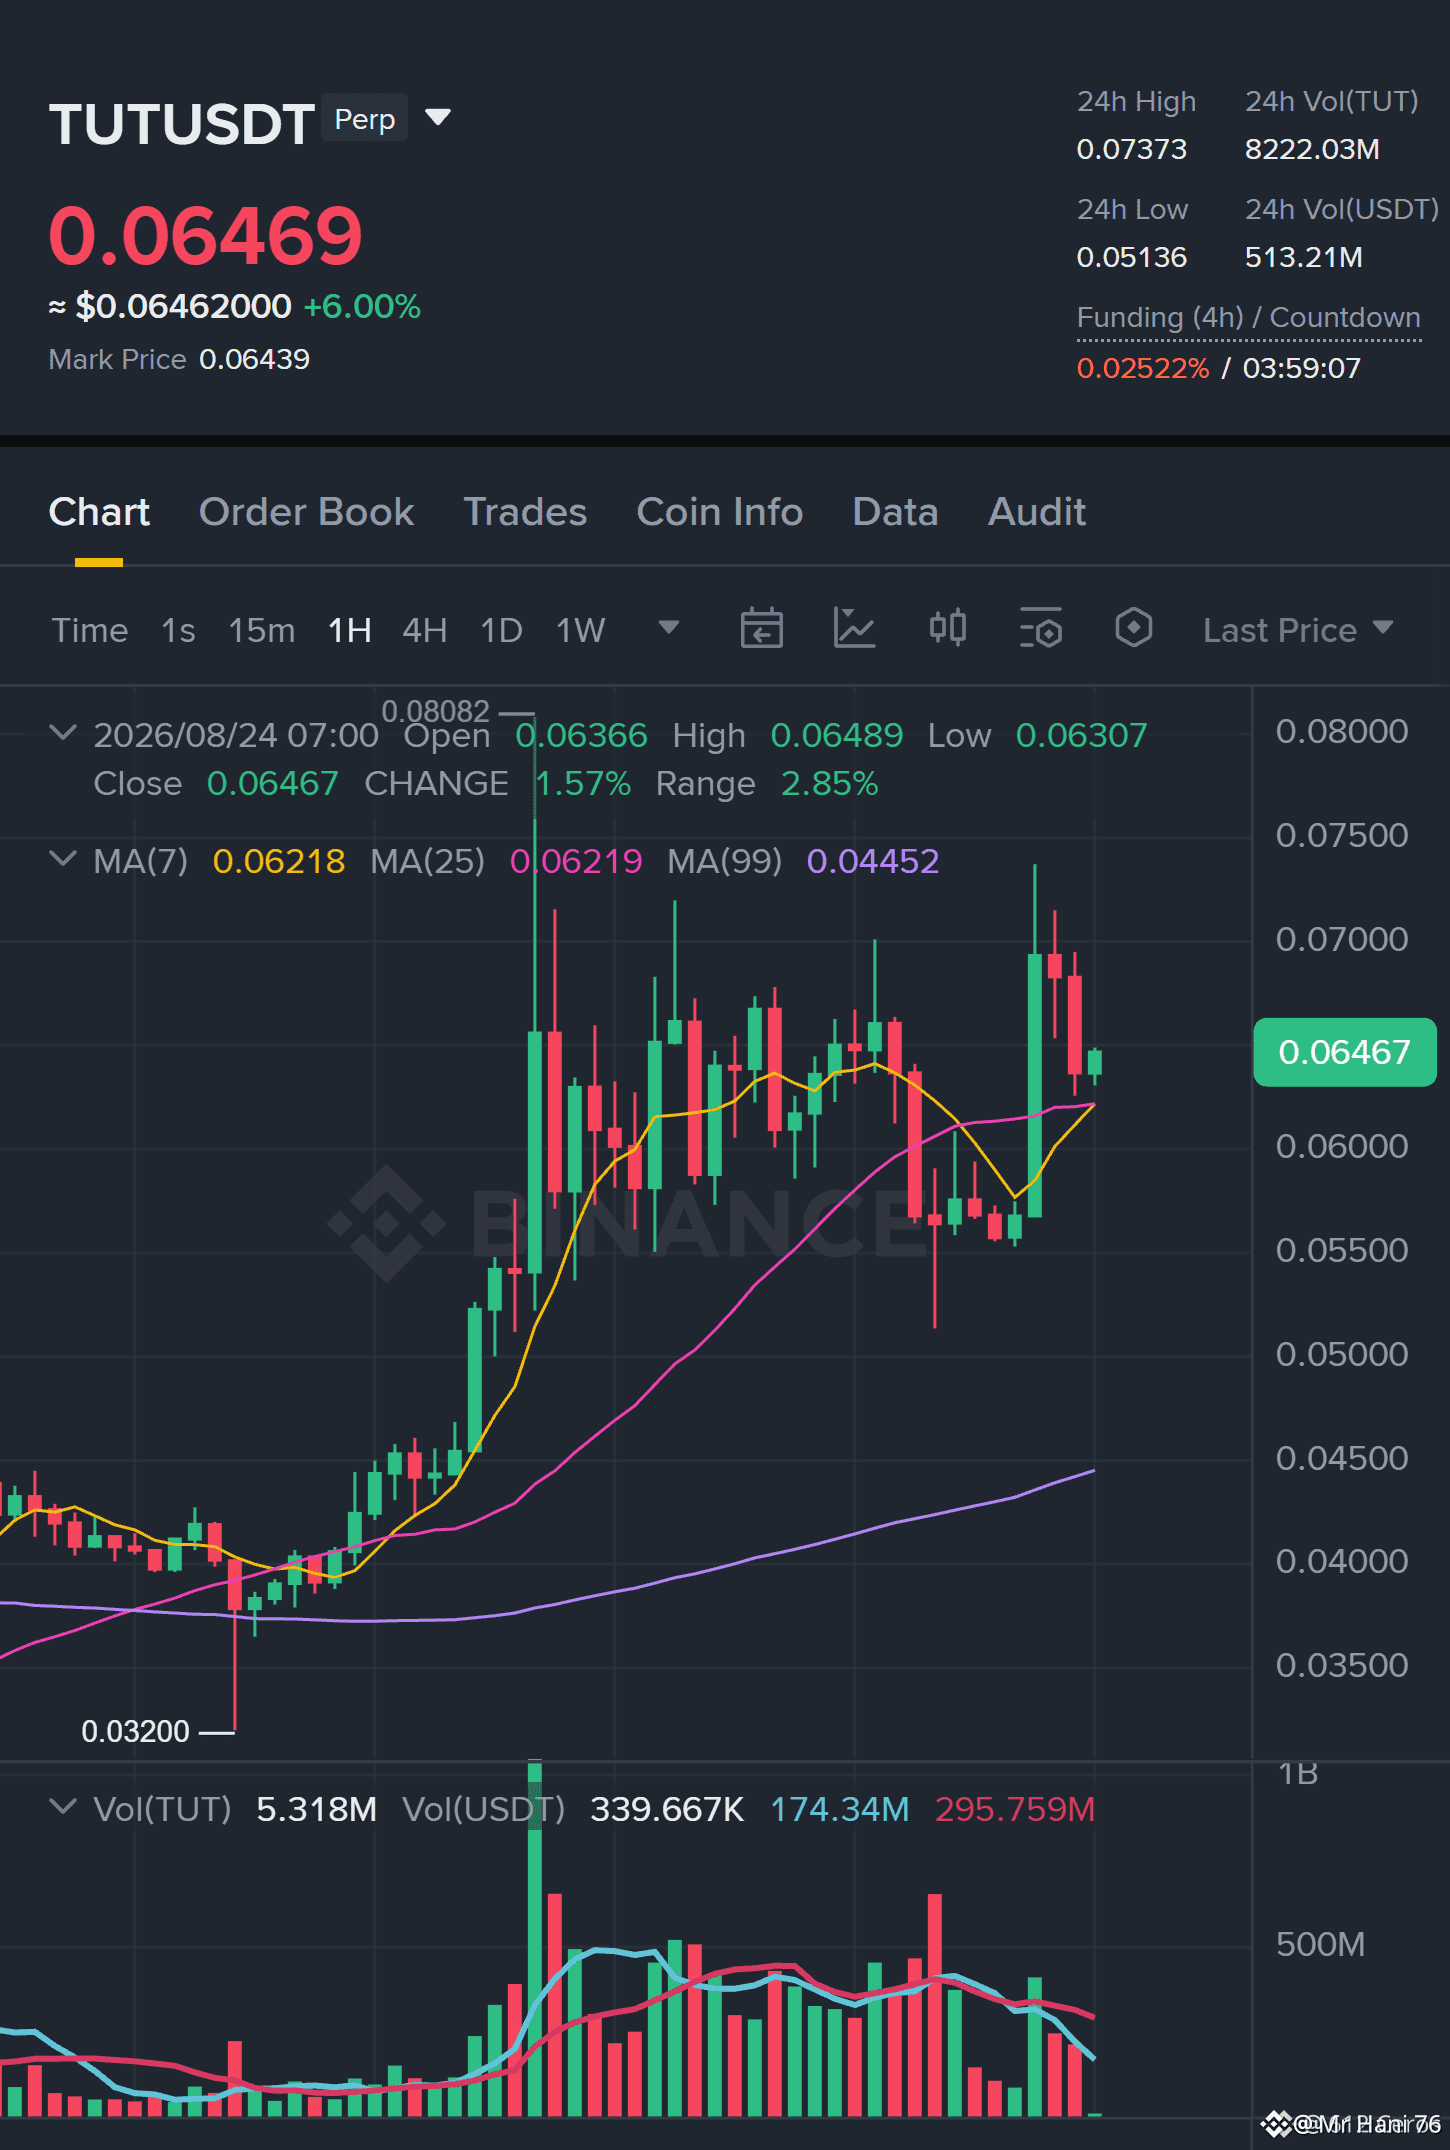
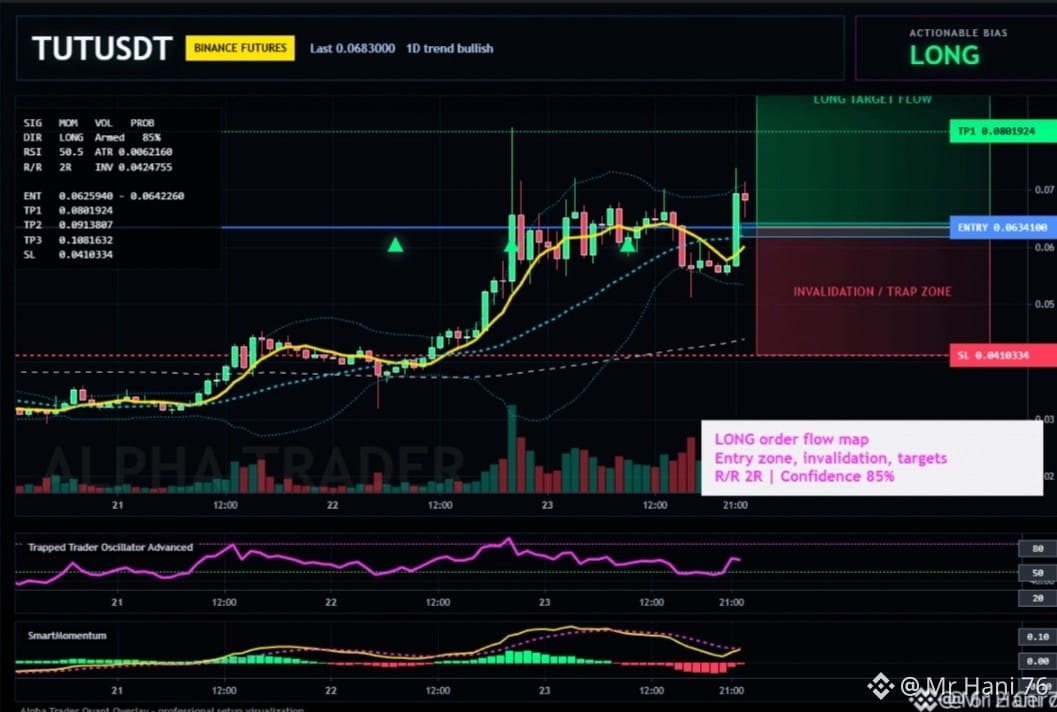
$TUT đang bùng cháy.🔥🚀 Hãy làm theo hướng dẫn của tôi để kiếm lợi nhuận. Chiến lược giao dịch Spot** * **Trạng thái hiện tại:** Hiện bạn đang đứng gần mép trên của vùng vào lệnh gợi ý ($0.0634 – $0.0646). * **Thực hiện giao dịch Spot:** Vì bạn mua spot (không sử dụng đòn bẩy), mua tại đây hoặc chờ một nhịp điều chỉnh nhẹ về **$0.0625 - $0.0635** mang lại tỷ lệ rủi ro/ lợi nhuận khá ổn cho kế hoạch nắm giữ hướng tới **$0.080+**. * **Kiểm soát rủi ro:** Nếu giá giảm mạnh xuống dưới vùng $0.055 - $0.050 thì cấu trúc tăng sẽ bị phá vỡ. Lưu ý: DYOR Phần trên đã giải thích phân tích để tôi tự nỗ lực thực hiện. Đây không phải là lời khuyên tài chính; vui lòng tự nghiên cứu trước khi {future}(TUTUSDT) $TUT
$TUT
đang bùng cháy.🔥🚀
Hãy làm theo hướng dẫn của tôi để kiếm lợi nhuận.

Chiến lược giao dịch Spot**
* **Trạng thái hiện tại:** Hiện bạn đang đứng gần mép trên của vùng vào lệnh gợi ý ($0.0634 – $0.0646).
* **Thực hiện giao dịch Spot:** Vì bạn mua spot (không sử dụng đòn bẩy), mua tại đây hoặc chờ một nhịp điều chỉnh nhẹ về **$0.0625 - $0.0635** mang lại tỷ lệ rủi ro/ lợi nhuận khá ổn cho kế hoạch nắm giữ hướng tới **$0.080+**.
* **Kiểm soát rủi ro:** Nếu giá giảm mạnh xuống dưới vùng $0.055 - $0.050 thì cấu trúc tăng sẽ bị phá vỡ.

Lưu ý: DYOR
Phần trên đã giải thích phân tích để tôi tự nỗ lực thực hiện. Đây không phải là lời khuyên tài chính; vui lòng tự nghiên cứu trước khi

$TUT
Xem bản dịch
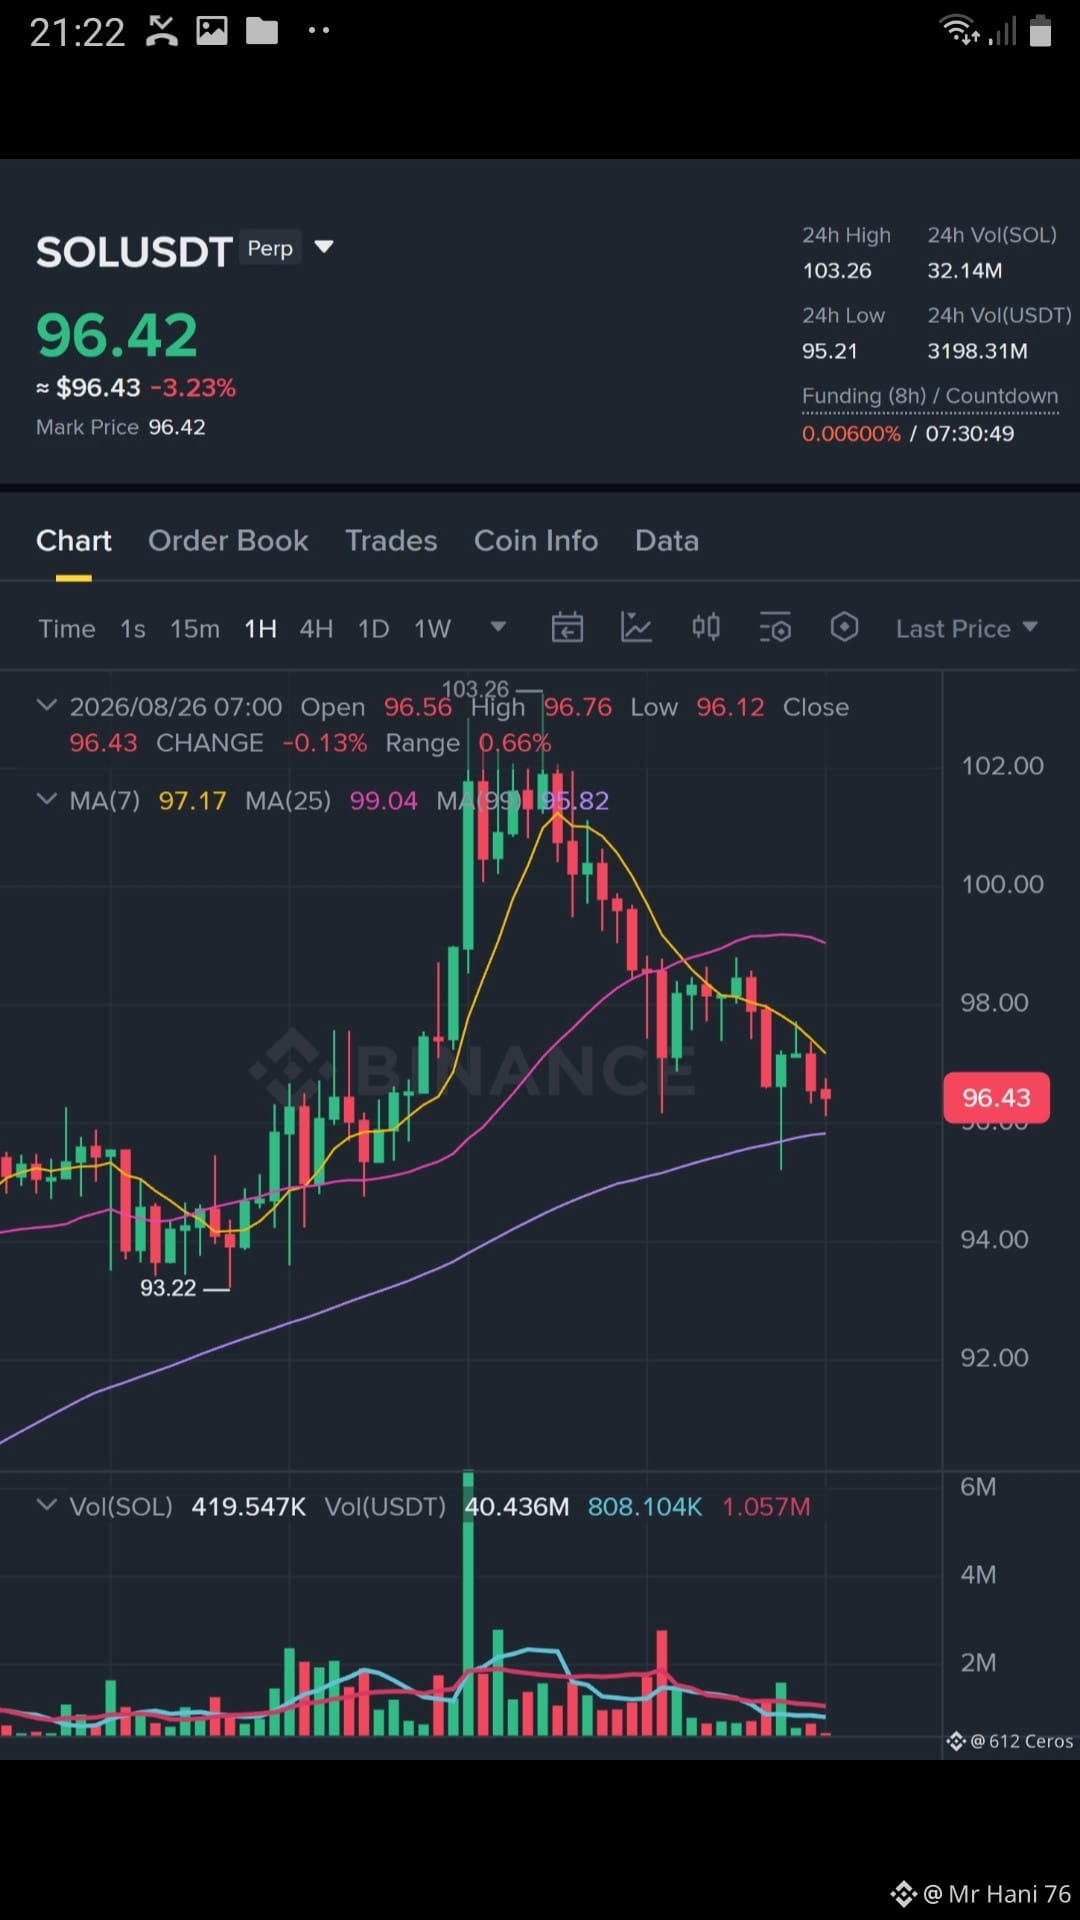
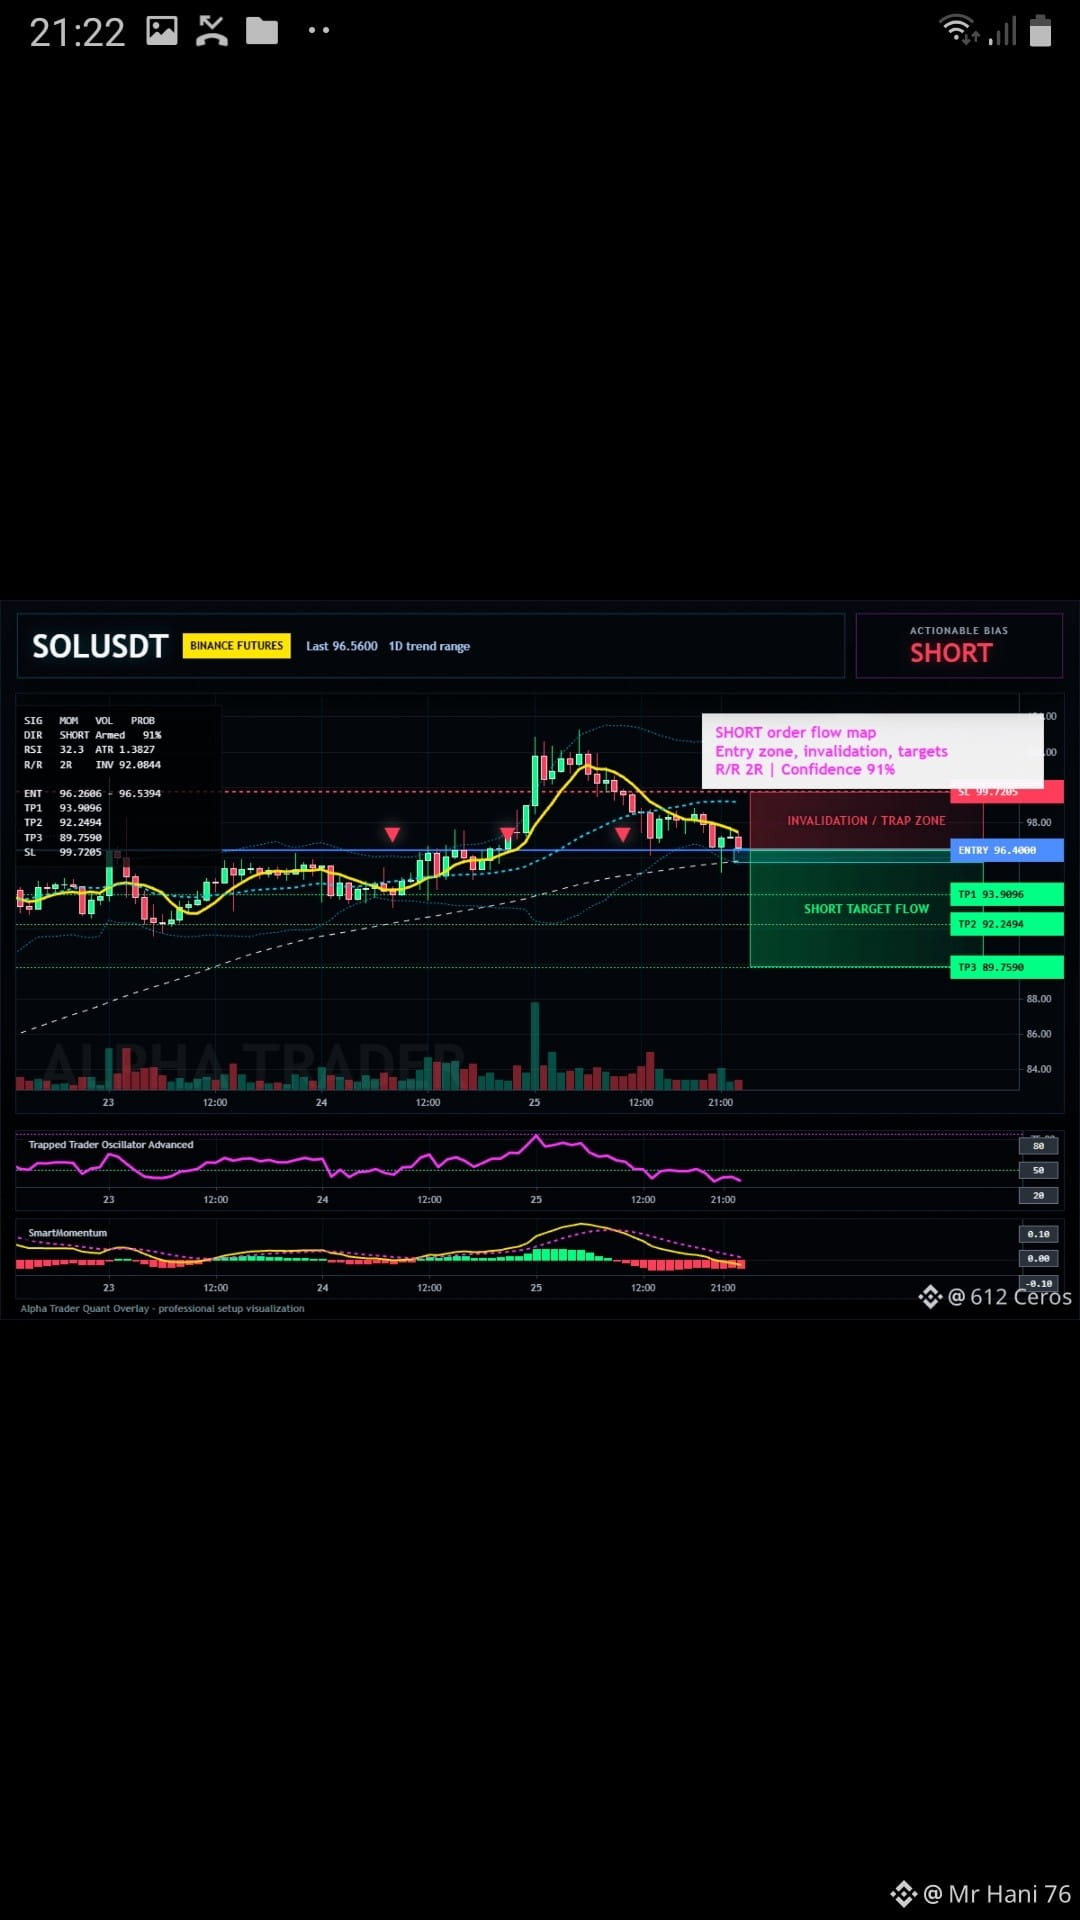
$SOL is on fire.🔥🚀 Follow my instruction to get profit. $SOL ☉ Aug 26 Market structure looks heavily heavy here. Price got rejected hard at the $103 high and we're breaking down into a clear short-term downtrend. Classic post-liquidity sweep price action — price is tracking below key MAs and setting up for a move into lower support pockets. **Trade Map:** * **Short Trigger:** Entry around $96.40 * **Invalidation (SL):** $99.73 (Keep it tight) * **Targets:** $93.90 | $92.34 | $89.75 Spot traders: Stay on your hands for now. No buy confirmation until we test the $89-$93 demand zone and see a proper reversal. Pure spec. Not financial advice. Always use stops & manage risk. #SOLUSDT #CryptoAnalysis #Altcoins Note: DYOR Explained above Analysis to get my own effort.This is not fainancail advice please do your own research before {spot}(SOLUSDT) $SOL
$SOL is on fire.🔥🚀
Follow my instruction to get profit.

$SOL ☉ Aug 26

Market structure looks heavily heavy here. Price got rejected hard at the $103 high and we're breaking down into a clear short-term downtrend.
Classic post-liquidity sweep price action — price is tracking below key MAs and setting up for a move into lower support pockets.
**Trade Map:**

* **Short Trigger:** Entry around $96.40
* **Invalidation (SL):** $99.73 (Keep it tight)
* **Targets:** $93.90 | $92.34 | $89.75
Spot traders: Stay on your hands for now. No buy confirmation until we test the $89-$93 demand zone and see a proper reversal.
Pure spec. Not financial advice. Always use stops & manage risk.
#SOLUSDT #CryptoAnalysis #Altcoins

Note: DYOR
Explained above Analysis to get my own effort.This is not fainancail advice please do your own research before

$SOL
Xem bản dịch
$SOL is on fire.🔥🚀 Follow my instruction to get profit. . * **The Rule:** In spot trading, you only make money when the price goes up. Entering a trade while indicator maps point downward increases your risk of immediate losses. **What to Do Instead** * **Wait for the Drop:** Let the price drop toward the support target zone between **$89.00 and $93.00**. * **Look for a Bounce:** Wait until the price stops falling at that level and forms a green, high-volume reversal candle. * **Buy Signal:** Enter spot only when lower timeframes begin making **higher highs** and **higher lows**. Note: DYOR Explained above Analysis to get my own effort.This is not fainancail advice please do your own research before $SOL {future}(SOLUSDT)
$SOL is on fire.🔥🚀
Follow my instruction to get profit.

.
* **The Rule:** In spot trading, you only make money when the price goes up. Entering a trade while indicator maps point downward increases your risk of immediate losses.

**What to Do Instead**
* **Wait for the Drop:** Let the price drop toward the support target zone between **$89.00 and $93.00**.
* **Look for a Bounce:** Wait until the price stops falling at that level and forms a green, high-volume reversal candle.
* **Buy Signal:** Enter spot only when lower timeframes begin making **higher highs** and **higher lows**.

Note: DYOR
Explained above Analysis to get my own effort.This is not fainancail advice please do your own research before
$SOL
Xem bản dịch
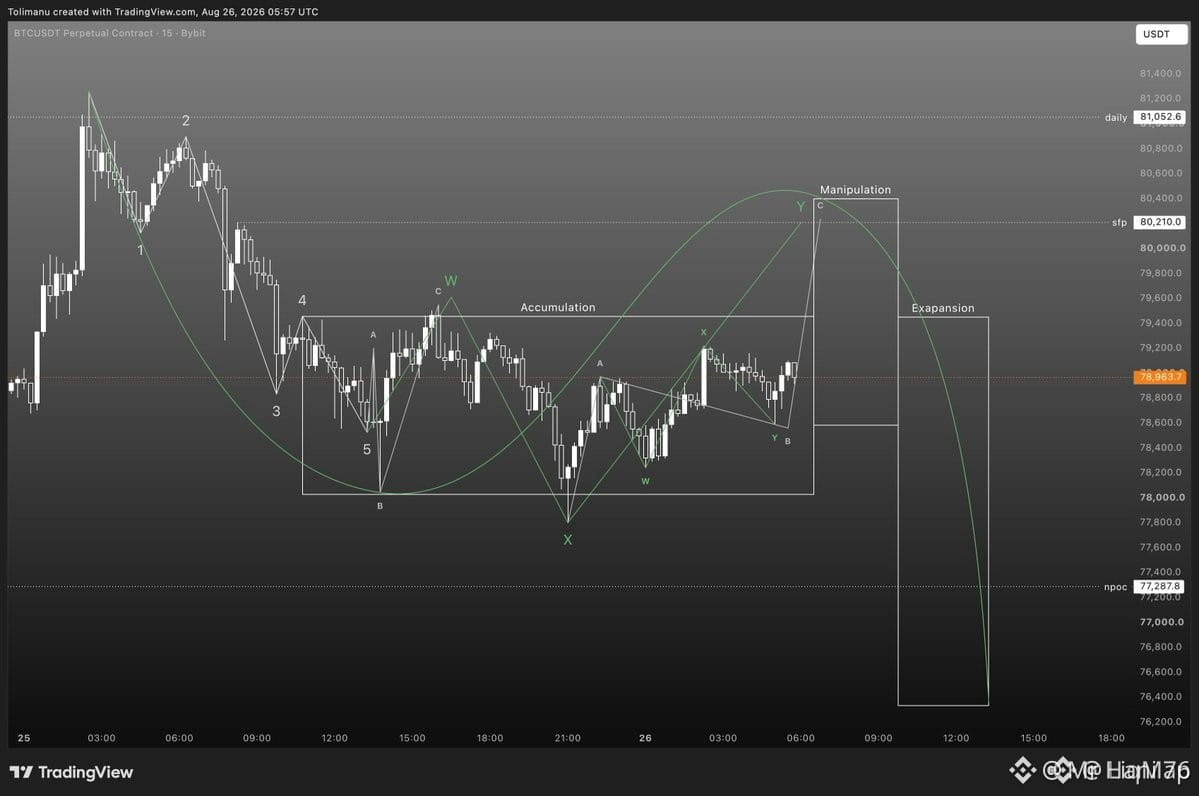
$BTC is on fire.🔥🚀 Follow my instruction to get profit. * **Do NOT put 100% in now:** If you have **$100** to invest, spend only **$20 to $25** at the current price. * **Wait for a price drop:** Keep the remaining **$75** to buy if the price falls into the **$74,000 – $76,000** range. * **Avoid FOMO:** Buying at the very top of a big jump often leads to temporary losses when the price corrects. In short: **Buy a small portion now, and save most of your cash to buy the dip.** Note: DYOR Explained above Analysis to get my own effort.This is not fainancail advice please do your own research before $BTC {spot}(BTCUSDT)
$BTC is on fire.🔥🚀
Follow my instruction to get profit.

* **Do NOT put 100% in now:** If you have **$100** to invest, spend only **$20 to $25** at the current price.
* **Wait for a price drop:** Keep the remaining **$75** to buy if the price falls into the **$74,000 – $76,000** range.
* **Avoid FOMO:** Buying at the very top of a big jump often leads to temporary losses when the price corrects.
In short: **Buy a small portion now, and save most of your cash to buy the dip.**

Note: DYOR
Explained above Analysis to get my own effort.This is not fainancail advice please do your own research before
$BTC
Xem bản dịch
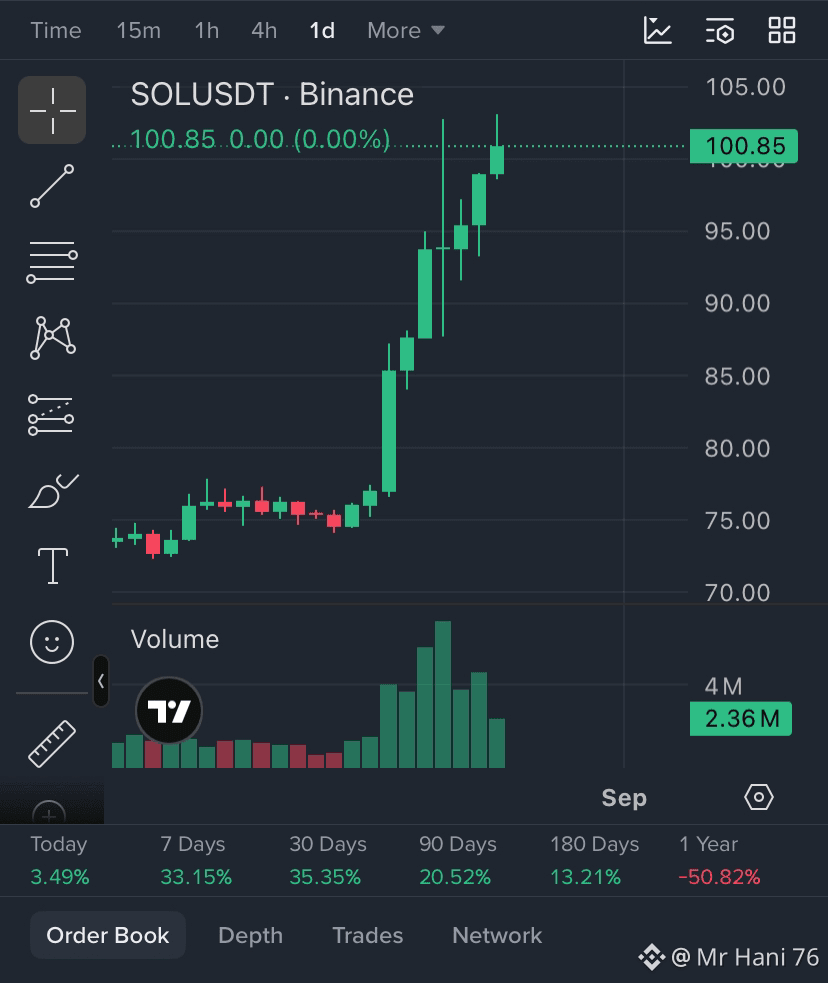
$BTC $SOL $ETH is on fire.🔥🚀 Follow my instruction to get profit. None of these charts present an ideal immediate spot entry, as all three assets (**SOL**, **ETH**, and **BTC**) are currently extending into sharp vertically stretched breakout candles after a heavy multi-day run. ### Chart Breakdown * **SOL/USDT ($100.85):** Solana broke past $100 on a massive green daily candle. However, buying near the high of a vertical move exposes you to sharp profit-taking pullbacks. * **ETH/USDT ($2,500.05):** Ethereum surged directly into resistance at $2,500 after consolidating near $1,900. It is showing a slightly rejection wick near the local top. * **BTC/USDT ($80,523.68):** Bitcoin broke out from $64,000 up above $80,000 in a rapid move. While the macro trend turned bullish, daily RSI conditions across the board indicate heavily overbought status. |---|---|---|---| | **SOL** | $100.85 | $105.00 | $88.00 – $92.00 | | **ETH** | $2,500.05 | $2,580.00 | $2,300 – $2,350 | | **BTC** | $80,523.68 | $83,000 | $72,000 – $75,000 | ### Spot Strategy Recommendation * **Avoid Chasing (FOMO):** Buying spot at the top of a parabolic candle significantly increases your short-term drawback risk. * **Wait for a Retest:** Allow the market to pull back or consolidate sideways to retest former resistance levels as new support before placing spot orders. * **DCA Approach:** If you prefer long-term holding over timing a entry, scale in with small percentage allocations rather than placing a 100% spot position at market price. Note: DYOR Explained above Analysis to get my own effort.This is not fainancail advice please do your own research before {spot}(SOLUSDT) {alpha}(10x72e4f9f808c49a2a61de9c5896298920dc4eeea9) {spot}(ETHUSDT)
$BTC $SOL $ETH is on fire.🔥🚀
Follow my instruction to get profit.

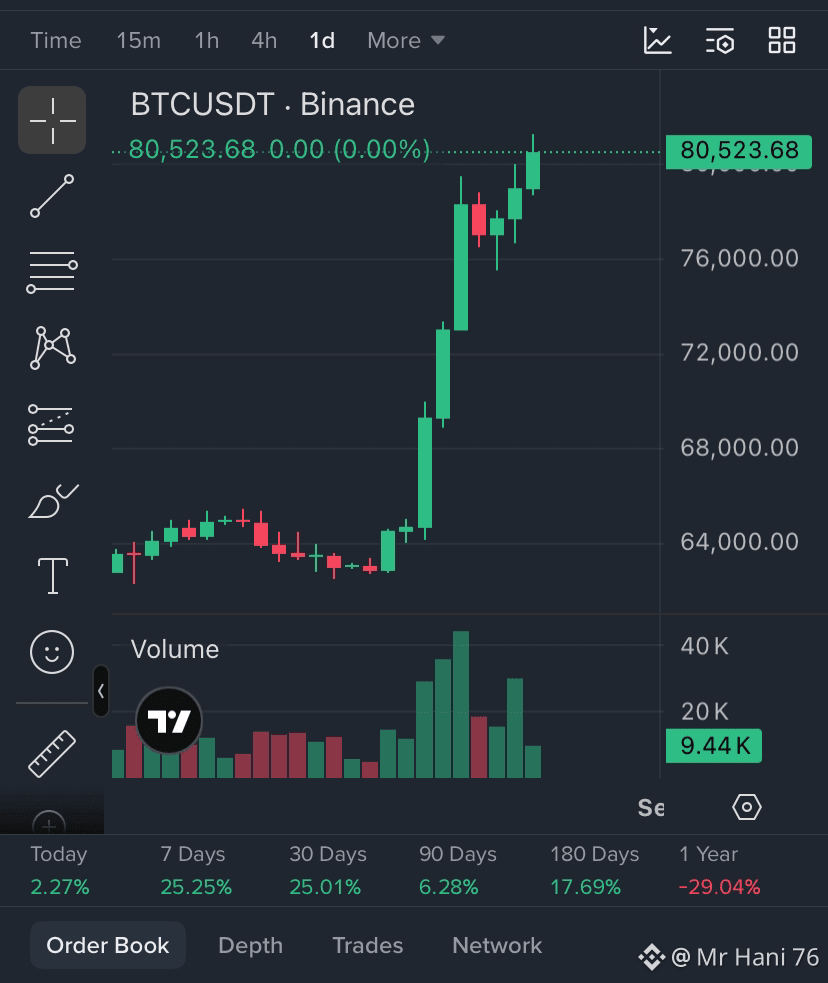
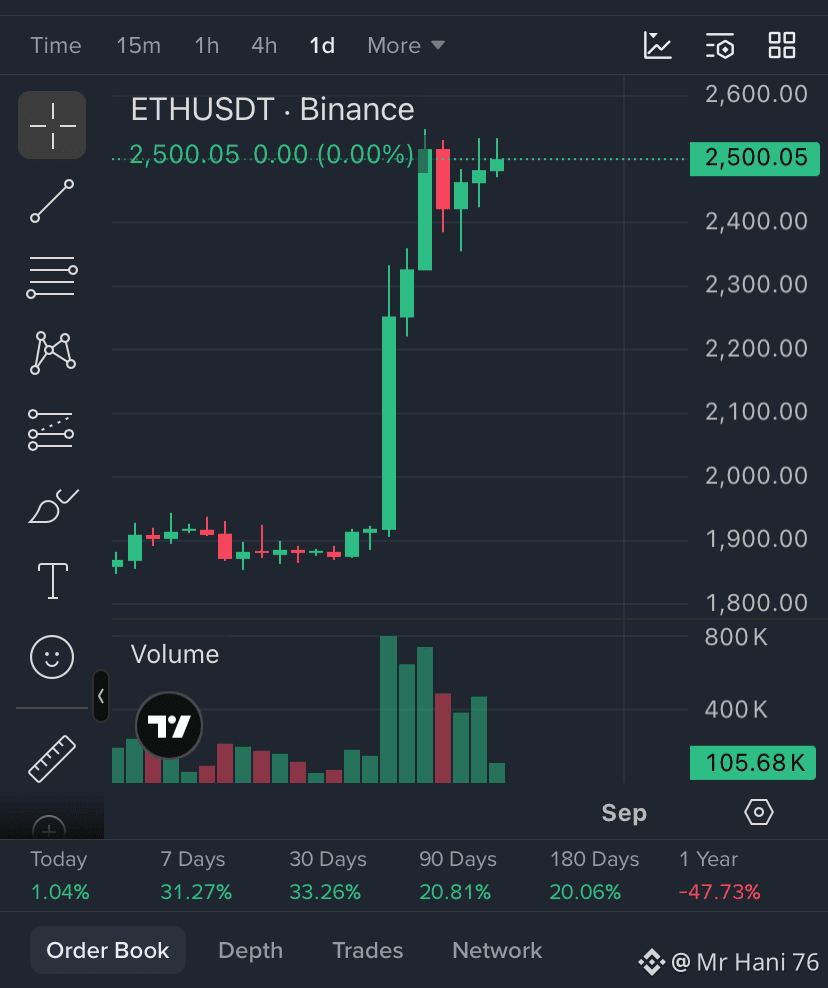
None of these charts present an ideal immediate spot entry, as all three assets (**SOL**, **ETH**, and **BTC**) are currently extending into sharp vertically stretched breakout candles after a heavy multi-day run.
### Chart Breakdown
* **SOL/USDT ($100.85):** Solana broke past $100 on a massive green daily candle. However, buying near the high of a vertical move exposes you to sharp profit-taking pullbacks.
* **ETH/USDT ($2,500.05):** Ethereum surged directly into resistance at $2,500 after consolidating near $1,900. It is showing a slightly rejection wick near the local top.
* **BTC/USDT ($80,523.68):** Bitcoin broke out from $64,000 up above $80,000 in a rapid move. While the macro trend turned bullish, daily RSI conditions across the board indicate heavily overbought status.

|---|---|---|---|
| **SOL** | $100.85 | $105.00 | $88.00 – $92.00 |
| **ETH** | $2,500.05 | $2,580.00 | $2,300 – $2,350 |
| **BTC** | $80,523.68 | $83,000 | $72,000 – $75,000 |
### Spot Strategy Recommendation
* **Avoid Chasing (FOMO):** Buying spot at the top of a parabolic candle significantly increases your short-term drawback risk.
* **Wait for a Retest:** Allow the market to pull back or consolidate sideways to retest former resistance levels as new support before placing spot orders.
* **DCA Approach:** If you prefer long-term holding over timing a entry, scale in with small percentage allocations rather than placing a 100% spot position at market price.

Note: DYOR
Explained above Analysis to get my own effort.This is not fainancail advice please do your own research before
Xem bản dịch
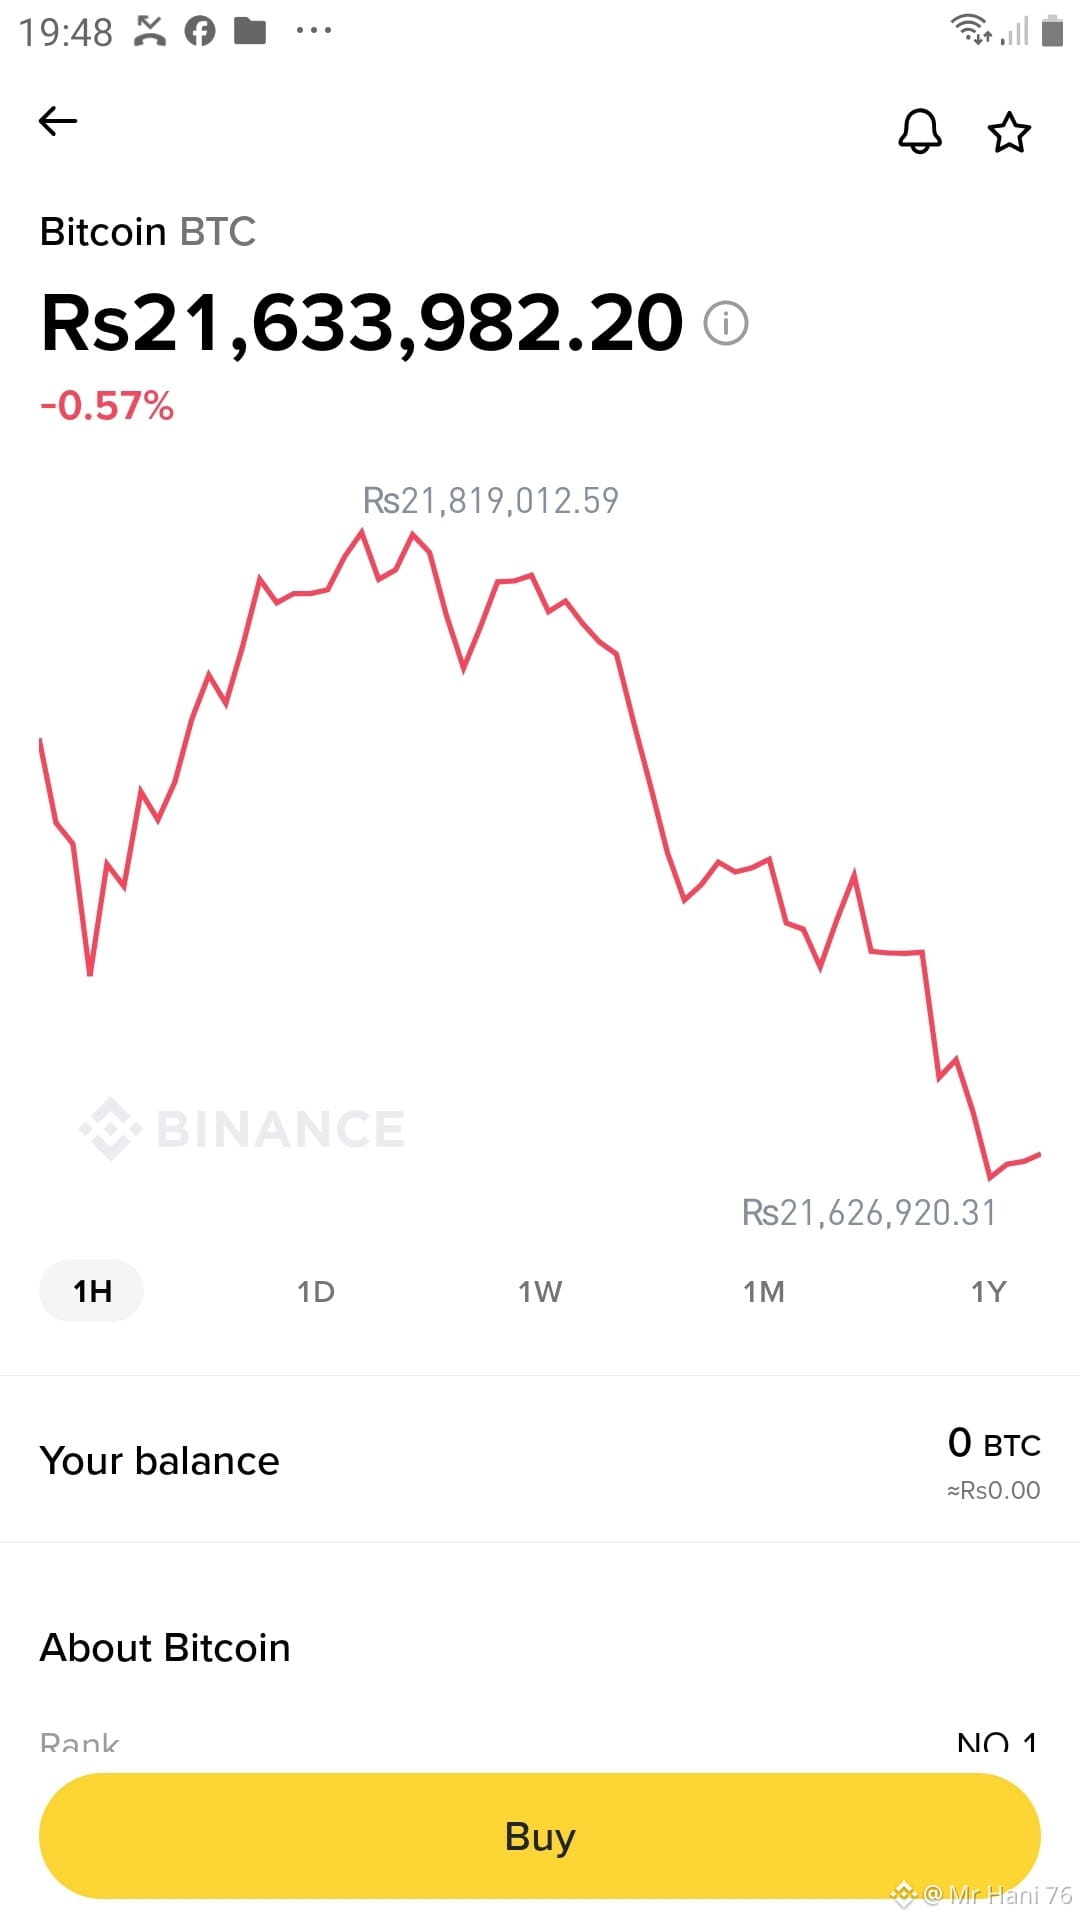
$BITCOIN is on fire.🔥🚀 Follow my instruction to get profit. The short-term trend shown on your 1-hour (**1H**) Bitcoin (BTC/PKR) chart shows a strong **downtrend/drop**, meaning buying right now carries immediate downside risk unless you wait for key signals. ### Chart Breakdown * **Current Momentum:** Price is falling aggressively from a high of **~Rs 21.81M** down to **~Rs 21.63M**. * **Price Action:** The chart shows a sequence of lower highs and lower lows over the past hour, indicating active selling pressure. * **Support Test:** The price recently bounced slightly off a local bottom (**~Rs 21.62M**), but there is no confirmed reversal pattern yet. ### Spot Buying Strategy * **Avoid FOMO Buying Immediately:** Buying mid-fall (catching a "falling knife") increases risk. * **Wait for Stabilization:** Wait for price to consolidate (move sideways) and form a solid base or higher low on the 15-minute or 1-hour timeframe. * **Dollar-Cost Averaging (DCA):** If you are buying for long-term spot holding rather than quick short-term profits, consider scaling in gradually with small buys instead of placing a full order all at once. * **Key Confirmation Level:** Look for price to break and hold back above **Rs 21.70M–21.75M** before entering short-term trades. Note: DYOR Explained above Analysis to get my own effort.This is not fainancail advice please do your own research before {alpha}(10x72e4f9f808c49a2a61de9c5896298920dc4eeea9) $BITCOIN
$BITCOIN is on fire.🔥🚀
Follow my instruction to get profit.

The short-term trend shown on your 1-hour (**1H**) Bitcoin (BTC/PKR) chart shows a strong
**downtrend/drop**,
meaning buying right now carries immediate downside risk unless you
wait for key signals.
### Chart Breakdown
* **Current Momentum:** Price is falling aggressively from a high of **~Rs 21.81M** down to **~Rs 21.63M**.
* **Price Action:** The chart shows a sequence of lower highs and lower lows over the past hour, indicating active selling pressure.
* **Support Test:** The price recently bounced slightly off a local bottom (**~Rs 21.62M**), but there is no confirmed reversal pattern yet.
### Spot Buying Strategy

* **Avoid FOMO Buying Immediately:** Buying mid-fall (catching a "falling knife") increases risk.
* **Wait for Stabilization:** Wait for price to consolidate (move sideways) and form a solid base or higher low on the 15-minute or 1-hour timeframe.
* **Dollar-Cost Averaging (DCA):** If you are buying for long-term spot holding rather than quick short-term profits, consider scaling in gradually with

small buys instead of placing a full order all at once.
* **Key Confirmation Level:** Look for price to break and hold back above **Rs 21.70M–21.75M** before entering short-term trades.

Note: DYOR
Explained above Analysis to get my own effort.This is not fainancail advice please do your own research before

$BITCOIN
Xem bản dịch
$USDC is on fire.🔥🚀 Follow my instruction to get profit. investment profit.** The pair in your screenshot is **USDC/USDT**, which is a comparison between two **stablecoins**. ### Key Analysis * **Stablecoin Nature:** Both USDC (USD Coin) and USDT (Tether) are pegged 1:1 to the US Dollar ($1.00 USD). * **Negligible Price Fluctuations:** The chart shows price action moving between **$1.00003** and **$1.00024** (fractional fractions of a cent). Buying here will produce virtually zero capital appreciation or trading profit. * **Purpose of the Pair:** Traders use USDC/USDT spot pairs to swap between stablecoins or rebalance holdings—not to buy low and sell high for profit. # What to Do Next * **To Earn Trading Returns:** Search for non-stablecoin pairs against USDT or USDC (such as **BTC/USDT**, **ETH/USDT**, or **SOL/USDT**) where market price fluctuations create potential trading opportunities. * **To Earn Income on Stablecoins:** If you already hold USDC or USDT and do not wish to trade volatile assets, consider using products like **Binance Simple Earn** or Flexible Yield to generate interest rather than spot trading the pai $USDC Note: DYOR Explained above Analysis to get my own effort.This is not fainancail advice please do your own research before {spot}(USDCUSDT) $USDC
$USDC is on fire.🔥🚀
Follow my instruction to get profit.
investment profit.**
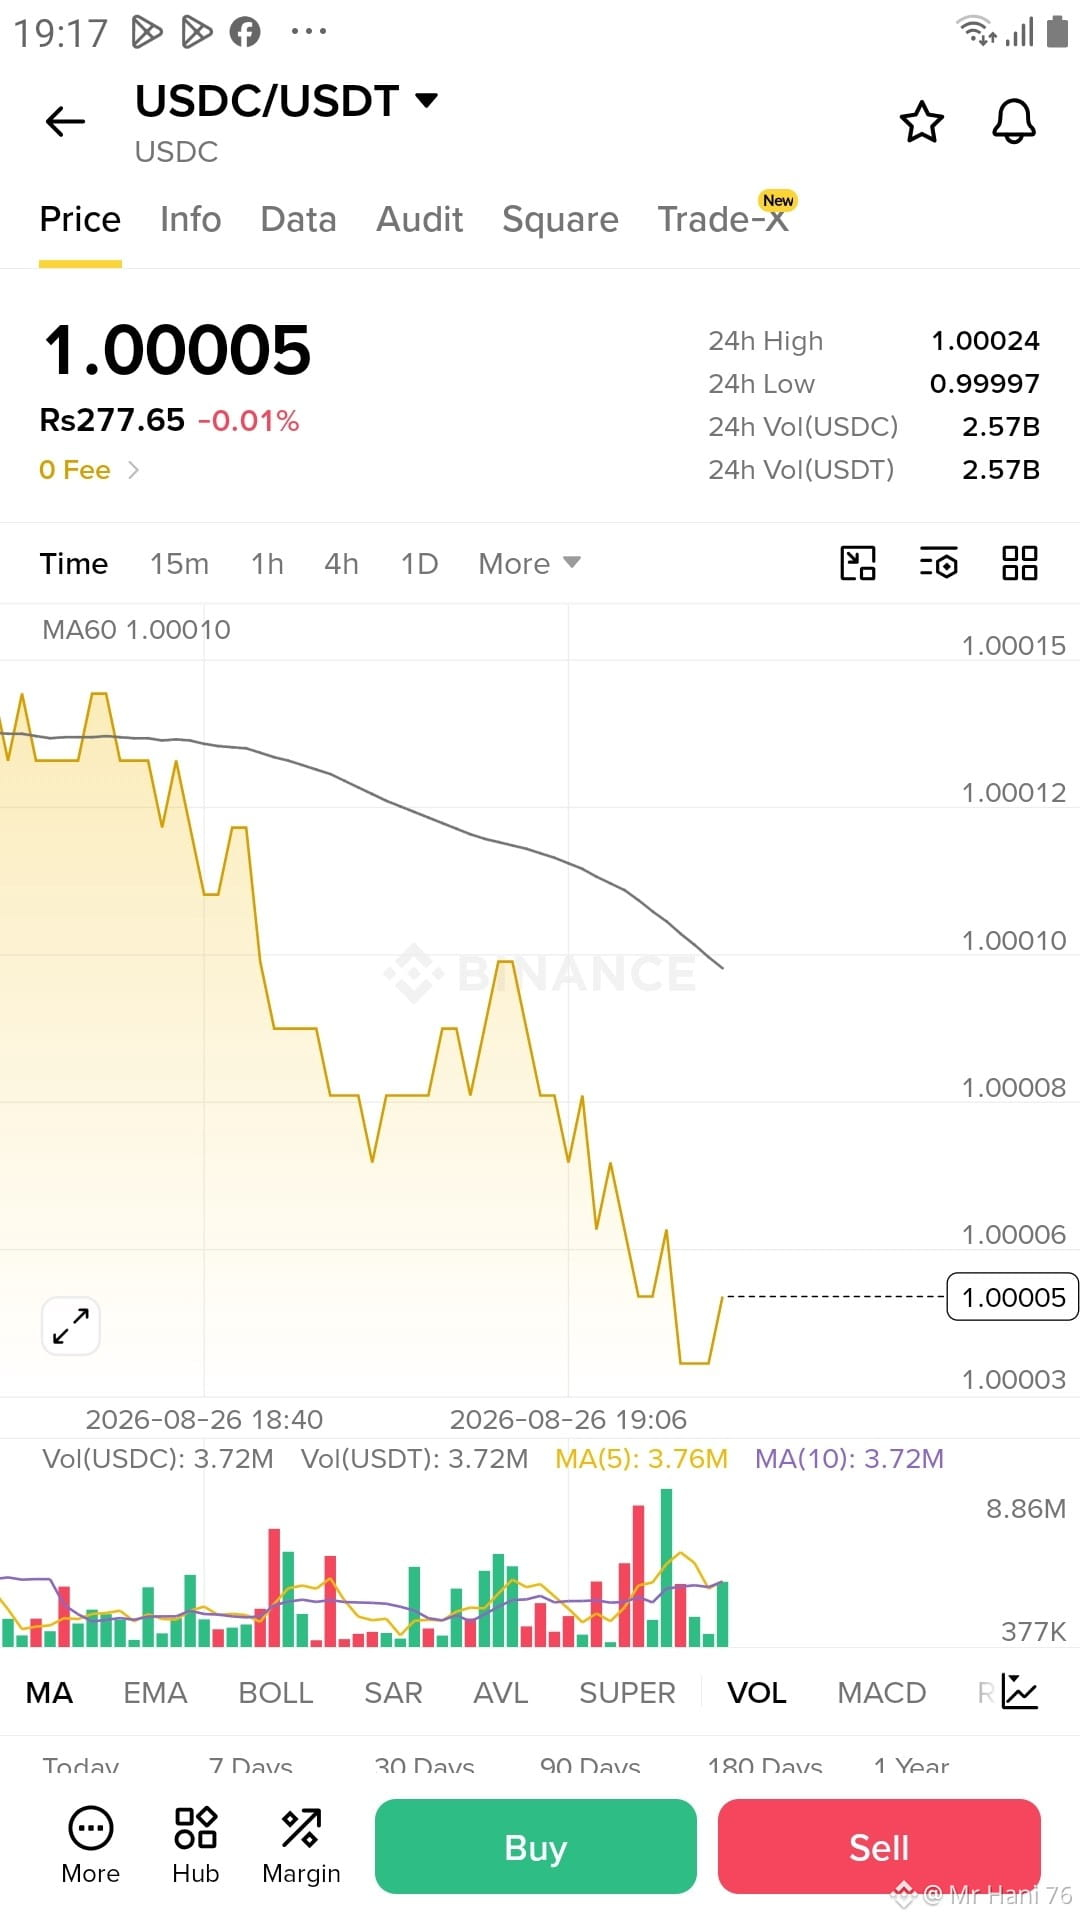
The pair in your screenshot is **USDC/USDT**, which is a comparison between two **stablecoins**.
### Key Analysis

* **Stablecoin Nature:** Both USDC (USD Coin) and USDT (Tether) are pegged 1:1 to the US Dollar ($1.00 USD).

* **Negligible Price Fluctuations:** The chart shows price action moving between **$1.00003** and **$1.00024** (fractional fractions of a cent). Buying here will produce virtually zero capital appreciation or trading profit.

* **Purpose of the Pair:** Traders use USDC/USDT spot pairs to swap between stablecoins or rebalance holdings—not to buy low and sell high for profit.
# What to Do Next
* **To Earn Trading Returns:** Search for non-stablecoin pairs against USDT or USDC (such as **BTC/USDT**, **ETH/USDT**, or **SOL/USDT**) where market price fluctuations create potential trading opportunities.
* **To Earn Income on Stablecoins:** If you already hold USDC or USDT and do not wish to trade volatile assets, consider using products like **Binance Simple Earn** or Flexible Yield to generate interest rather than spot trading the pai
$USDC

Note: DYOR
Explained above Analysis to get my own effort.This is not fainancail advice please do your own research before

$USDC
Xem bản dịch
Xem bản dịch
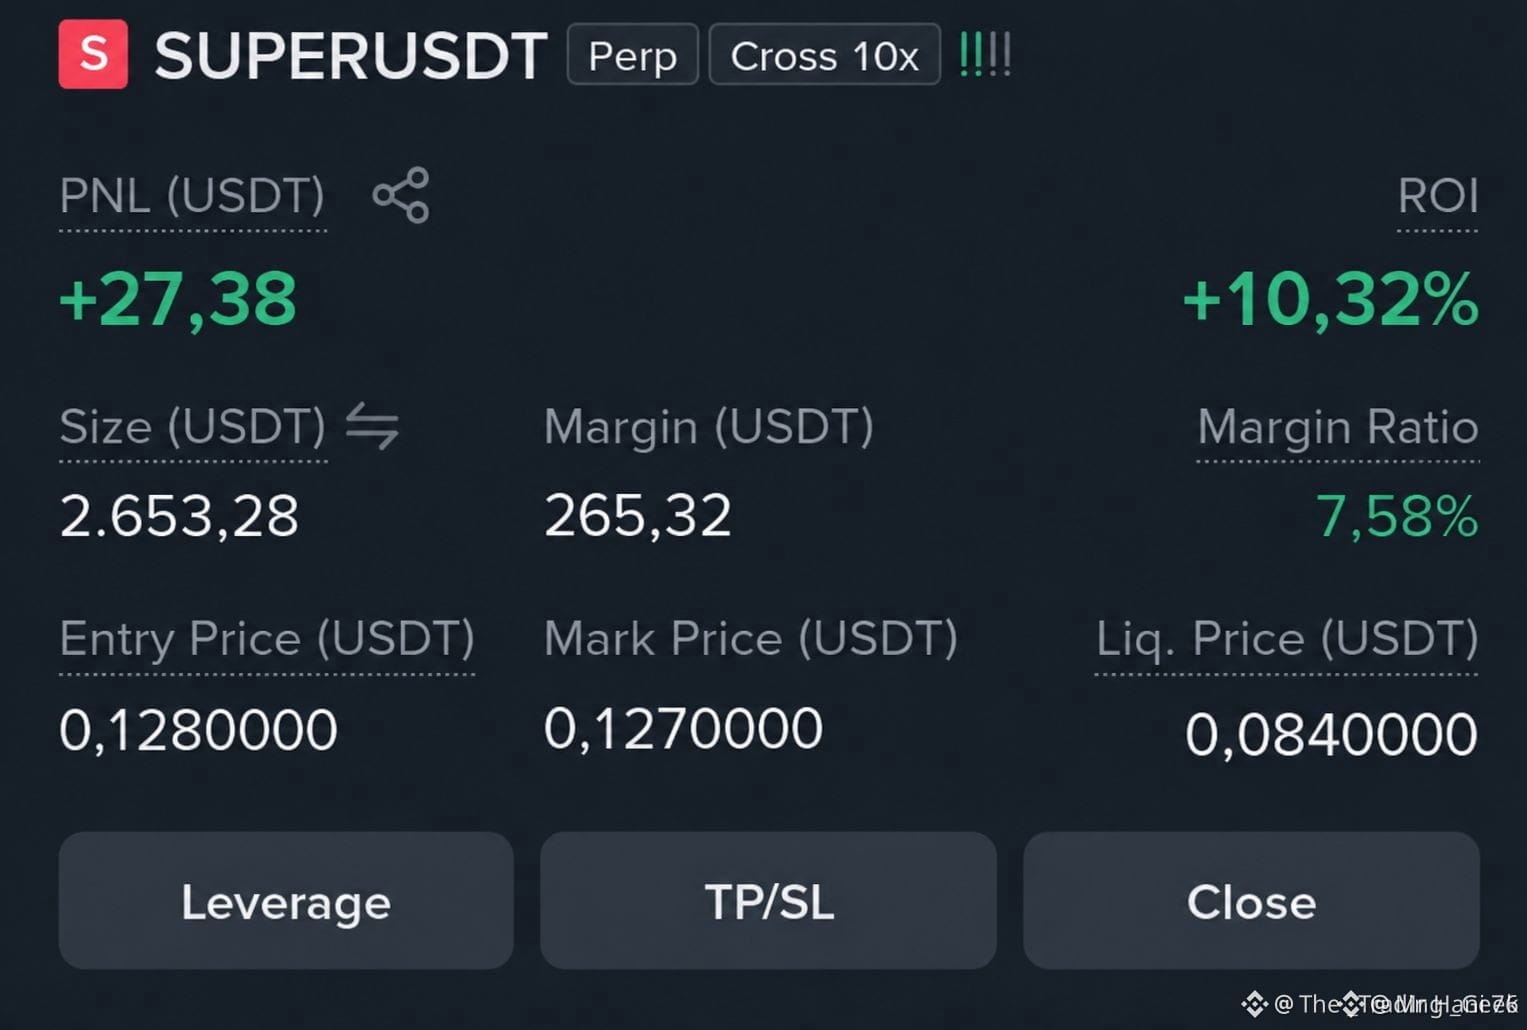
$SUPER SHORT SETUP 📉🔥 $SUPER par mujhe short setup strong lag raha hai. Agar selling pressure continue raha to price in levels ko target kar sakta hai: 🎯 0.1063 🎯 0.0954 🎯 0.0850 🎯 0.0750 I’m watching the downside from here. Trade safe and DYOR. ⚠️ $SUPER {spot}(SUPERUSDT)
$SUPER SHORT SETUP 📉🔥
$SUPER par mujhe short setup strong lag raha hai. Agar selling pressure continue raha to price in levels ko target kar sakta hai:
🎯 0.1063
🎯 0.0954
🎯 0.0850
🎯 0.0750
I’m watching the downside from here. Trade safe and DYOR. ⚠️
$SUPER
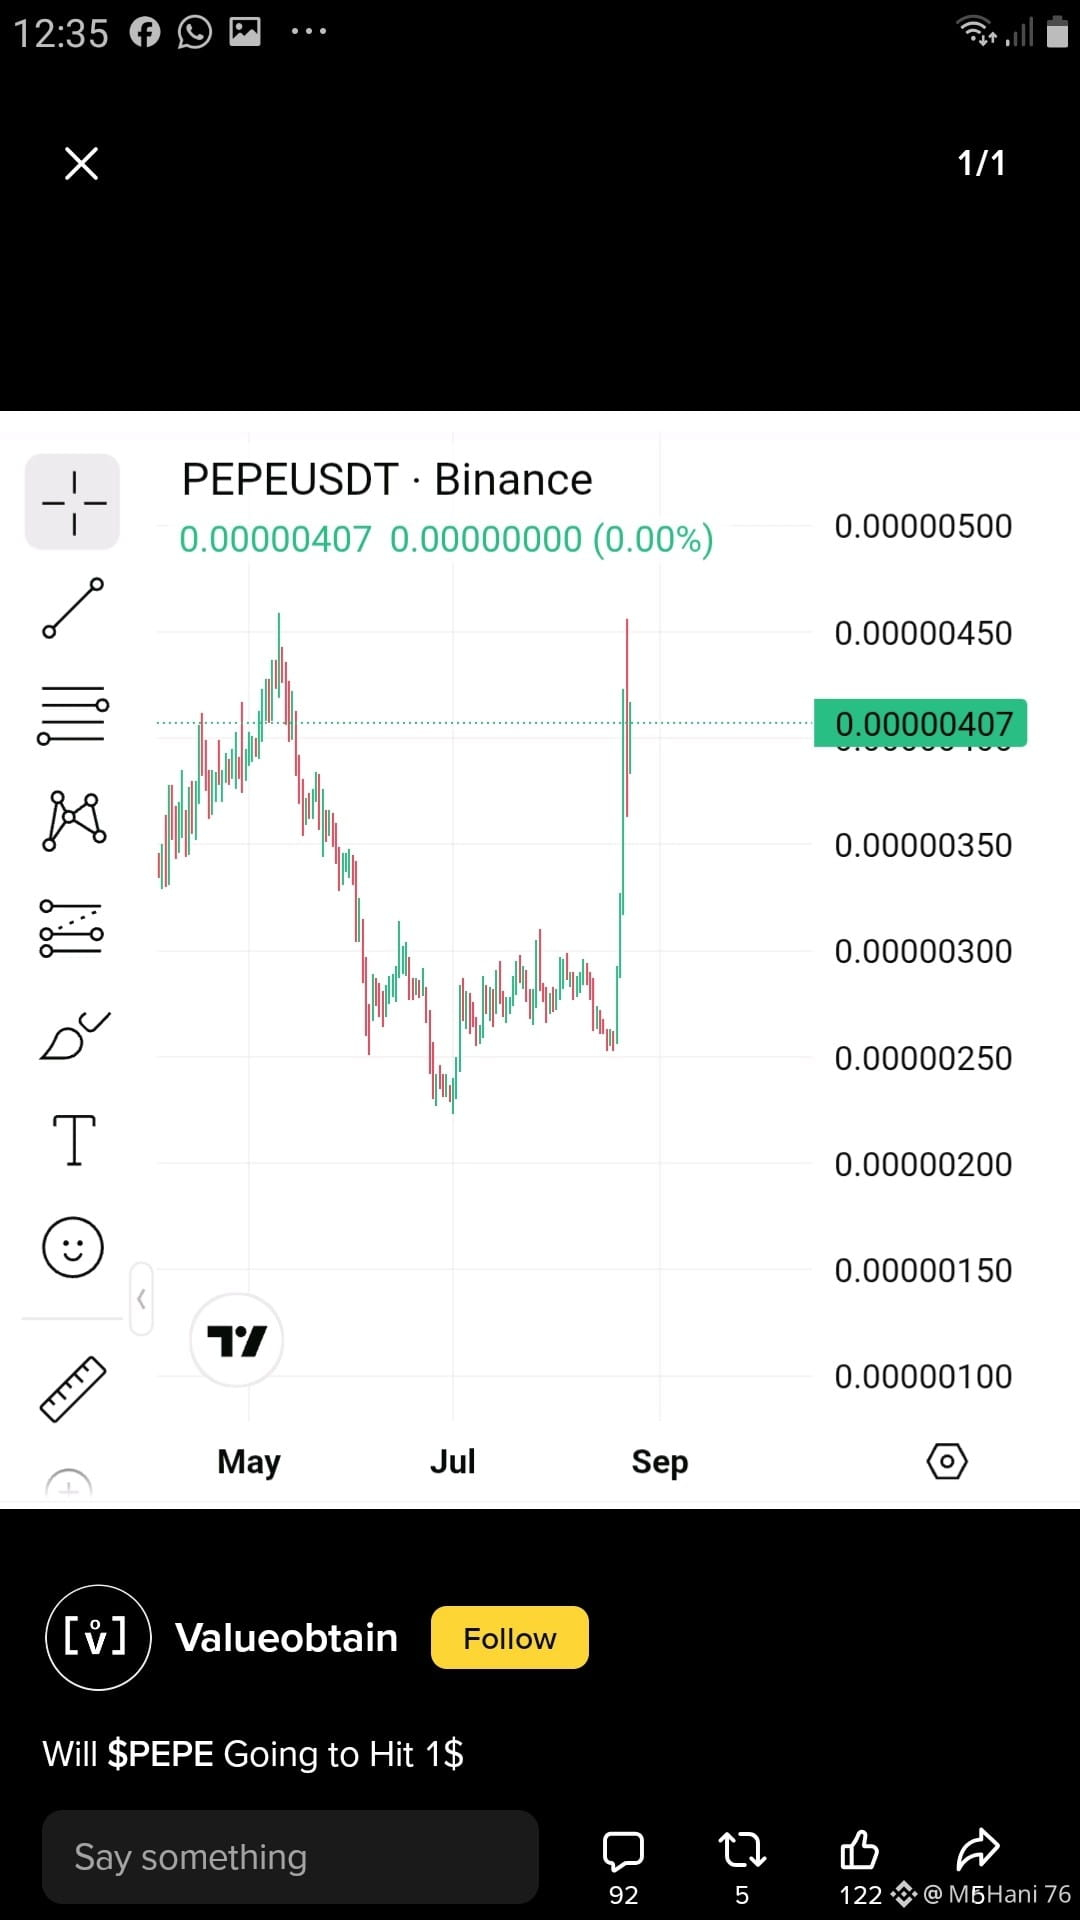
Tại sao trông như đây là một cú đẩy cuối cùng của $TUT xuống 0.08 Liệu nó có thể đột ngột sụp đổ không Chúng ta có thể tin được không 🥺 {spot}(TUTUSDT)
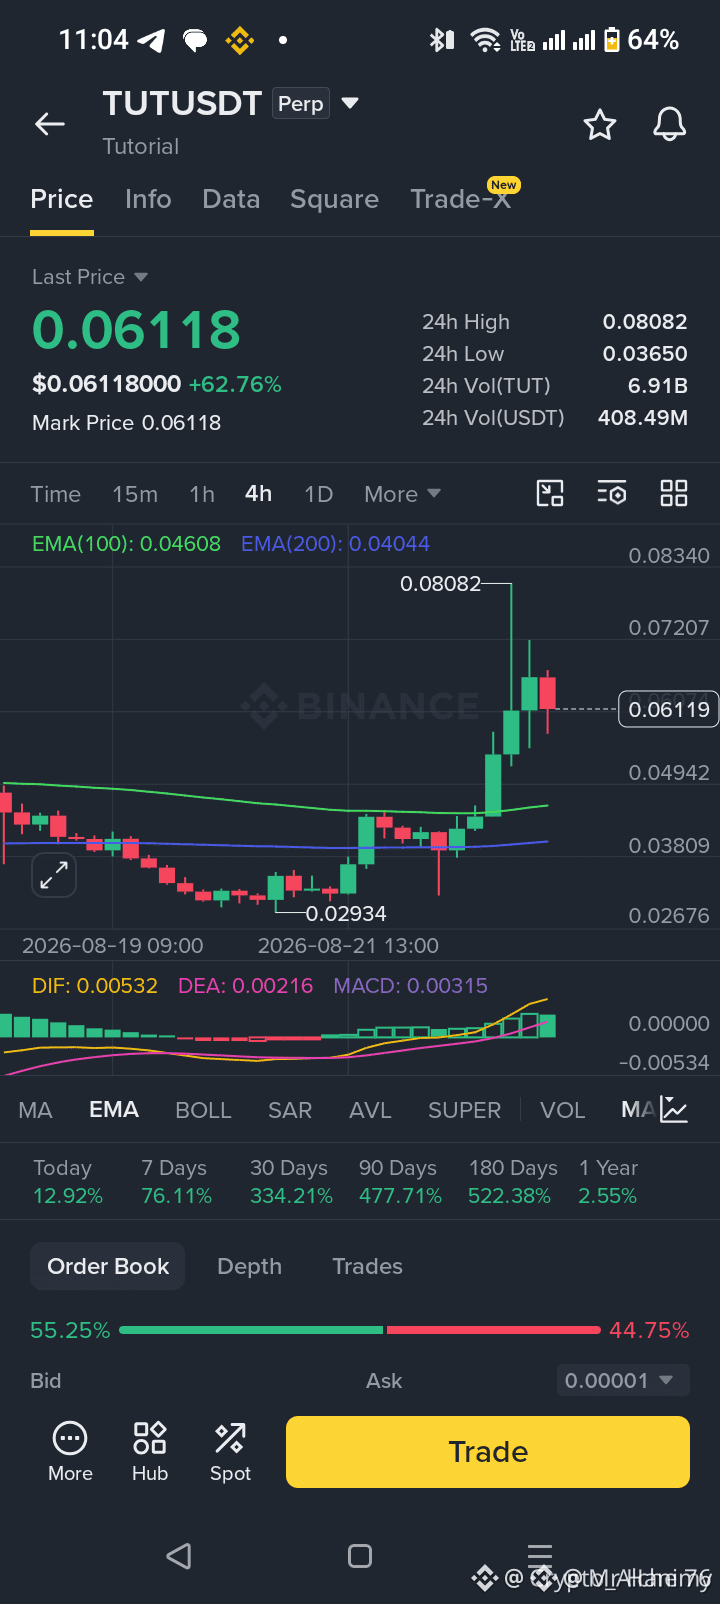
Tại sao trông như đây là một cú đẩy cuối cùng của $TUT xuống 0.08
Liệu nó có thể đột ngột sụp đổ không
Chúng ta có thể tin được không 🥺
Bài viết
Xem bản dịch
Bitcoin News: Bitcoin Steadies at $77,800 as Falling Open Interest Confirms the Rally Was Spot-DriveBitcoin News: Bitcoin Steadies at $77,800 as Falling Open Interest Confirms the Rally Was Spot-Driven, Not Leveraged Binance News Verified Binance official account Follow Bitcoin traded around $77,800 Monday morning — little changed since midnight UTC — as markets digested one of the sharpest weekly rallies in over three years. The pause follows a week in which BTC surged roughly 24% from below $63,000 in its best performance since March 2023, after the US Treasury's decision to double buybacks of long-dated bonds cracked a six-week trading range and triggered more than $3 billion in short liquidations in 24 hours. Gold added around 0.8% Monday morning and sits near record highs as Treasury Secretary Bessent's debt management strategy continued to weigh on long-dated yields — the 30-year bond yield briefly touched a 19-year high before the buyback announcement pulled it back. Bitcoin futures open interest declined to a two-month low of 715,000 BTC from the August 18 high of 762,000 BTC — the most analytically significant derivatives development of the session, confirming that last week's surge was driven by spot buying and short unwinding rather than leveraged bullish positioning. Falling Open Interest Into a 24% Rally  Open interest declining from 762,000 BTC to a two-month low of 715,000 BTC while Bitcoin rallied 24% is the structural signature of a genuinely spot-driven advance rather than a leverage-fueled squeeze. In leveraged rallies, open interest rises as traders add new long positions — the price appreciation and the leverage build reinforce each other until the position becomes crowded and vulnerable to a liquidation cascade. In spot-driven rallies, open interest falls as existing short positions are closed and no new leveraged longs replace them — the buying is coming from participants purchasing actual Bitcoin rather than derivatives exposure. The 47,000 BTC decline in open interest across the rally week — combined with the $3 billion in short liquidations — describes exactly this: shorts closing positions, reducing total open interest, while spot buyers absorbed the resulting demand without adding new leveraged exposure. ETH, SOL, and XRP futures revealed the same pattern of OI declines amid price rallies, confirming that the spot-driven dynamic extended across majors rather than being Bitcoin-specific. This is the structurally healthiest configuration a rally can have. It directly addresses the sustainability question CryptoQuant raised when its 30-day apparent spot demand approached the zero-cross: whether the spot bid that emerged behind the squeeze holds once forced covering stops. Falling open interest into a rising price says the answer is yes — the buying is spot, not futures. BVIV at 47% — Volatility Exploding Higher During a Rally Bitcoin's 30-day implied volatility climbing to 47% annualized from 36% a week ago is an unusual configuration that deserves specific attention. The BVIV index is widely treated as a fear gauge that typically spikes during selloffs — implied volatility rising during a price rally is the exception rather than the rule. Ether's EVIV index surged similarly. The rise from 36% to 47% during a 24% price advance reflects the market repricing the probability distribution of future outcomes rather than pricing fear. When Bitcoin was range-bound between $61,500 and $66,900 for six weeks, options markets could price a narrow distribution of likely outcomes — hence BVIV at multi-year lows of 35-36%. The breakout through $66,600, $70,000, $75,385, and $79,400 in five sessions widened that distribution dramatically: Bitcoin is now capable of moving in either direction with substantially more magnitude than the range period implied. Options sellers require higher premiums to underwrite that wider distribution regardless of direction. For traders who followed TDX Strategies' December strangle recommendation at BVIV 35.59% lows, the move from 36% to 47% represents a significant mark-to-market gain on the volatility component of the position independent of the directional gain from Bitcoin's price advance. The article that noted implied volatility at 36% was 65% above realized volatility of 21.8% now has its resolution: realized volatility has caught up dramatically as the range broke, and implied volatility has expanded further to reflect the new regime. ZEC — The Only Major With Rising OI Alongside Rising Price Zcash's open interest climbing to 2.24 million tokens from 1.81 million a week ago — while its price rose over 70% — is the inverse of the pattern across BTC, ETH, SOL, and XRP, and it is the analytically stronger configuration for trend confirmation. Rising open interest alongside rising price means new capital is entering on the long side rather than shorts merely closing. The OI-adjusted weekly cumulative volume delta being the most positive among majors confirms that ZEC buyers have been leading price action through market orders rather than passive limit orders — aggressive directional conviction rather than opportunistic accumulation. ZEC's 70% weekly gain with confirming OI growth makes it the strongest trend-confirmed move among major cryptocurrencies in the current rally. The privacy sector catching a bid alongside the broader risk-on move — with Monero having been August's earlier privacy outperformer — describes a rotation that predates the Treasury buyback catalyst and has now been amplified by it. Funding Rates at 10% — No Signs of Overheating Annualized funding rates for BTC, ETH, and other majors hovering around 10% describes a market with a bullish bias but nothing resembling the overheated positioning that historically precedes sharp reversals. In prior cycle tops, funding rates have reached 50-100% annualized as leveraged long demand became extreme. At 10%, longs are paying a modest premium to maintain positions — consistent with genuine directional interest rather than crowded speculation. The 10% funding rate combined with falling open interest is the most constructive derivatives configuration available: bullish bias without leverage buildup, spot-driven price appreciation, and no crowded positioning vulnerable to a liquidation cascade. This is a materially different market structure than the 20-month high funding rates recorded just before the breakout — the rally has actually reduced the leverage risk rather than amplifying it, because shorts closing outweighed new longs opening. Options — Cautious Optimism With the $70,000 Put Leading Volume The Deribit call-put skew flipping positive at the front end — meaning short-dated calls are now pricier than puts — is the options market's confirmation of directional bullishness. But the 24-hour volume profile complicates that read: the $70,000 put topped the most active list, followed by call options. The combination describes cautious optimism rather than unrestrained bullishness — traders paying up for calls while simultaneously buying downside protection at $70,000, approximately 10% below spot. The $70,000 put as the most active contract is analytically coherent given the rally's speed. Bitcoin moved from $62,600 to $79,400 in five sessions. A pullback to $70,000 would represent a normal retracement of roughly 40% of that advance — the kind of consolidation that follows any parabolic move. Traders buying $70,000 puts are hedging that scenario without abandoning their bullish directional positioning. Altcoins Consolidating — Selective, Not Broad Rotation Bitcoin dominance holding near 59.2% with the Altcoin Season index at 42/100 — up from 33 on Friday but still firmly in Bitcoin territory — confirms that last week's altcoin outperformance was selective rather than a broad rotation. The standout performers had specific catalysts: ENA doubled to $1.79 following its $1 billion FalconX secured warehouse facility, AAVE rose more than 62% as DeFi tokens caught the broader risk-on bid, XRP gained 47% on the week, HYPE rose approximately 28% fueled in part by Trump's CFTC oversight comments before setting a record high of $83.30 late Sunday, and MORPHO gained 33% on the week. Monday's pullbacks — HYPE down 3.3% to $79.59 from its record, XRP down 2.8% to $1.48, MORPHO down 6.2% to $2.73 despite holding an 18% 24-hour gain, AAVE easing 0.6% to $140.68 — are profit-taking after sharp runs rather than trend reversals. The Altcoin Season index rising from 33 to 42 while Bitcoin dominance holds at 59.2% describes the early stage of rotation rather than its completion: capital is beginning to move into altcoins but Bitcoin remains the dominant destination. Gold Near Record Highs — the Parallel Trade Confirms the Macro Driver Gold adding 0.8% Monday and sitting near record highs — with Bessent's debt management strategy continuing to weigh on long-dated yields after the 30-year briefly touched a 19-year high — confirms that the Treasury buyback catalyst is driving both gold and Bitcoin through the same channel. Both assets are responding to the reduced term premium pressure, the dollar weakness, and the sovereign risk repricing that the buyback announcement produced. The gold-Bitcoin co-movement through a full week of the rally is the most sustained correlation between the two assets since the current cycle began — supporting the thesis that Bitcoin's institutional categorization may be shifting from purely liquidity-sensitive risk asset toward partial debasement hedge. Equities lagging while crypto and gold rallied in tandem is the specific relative performance signature that distinguishes a debasement trade from a general risk-on move. {alpha}(10x72e4f9f808c49a2a61de9c5896298920dc4eeea9)

Bitcoin News: Bitcoin Steadies at $77,800 as Falling Open Interest Confirms the Rally Was Spot-Drive

Bitcoin News: Bitcoin Steadies at $77,800 as Falling Open Interest Confirms the Rally Was Spot-Driven, Not Leveraged
Binance News
Verified Binance official account
Follow
Bitcoin traded around $77,800 Monday morning — little changed since midnight UTC — as markets digested one of the sharpest weekly rallies in over three years. The pause follows a week in which BTC surged roughly 24% from below $63,000 in its best performance since March 2023, after the US Treasury's decision to double buybacks of long-dated bonds cracked a six-week trading range and triggered more than $3 billion in short liquidations in 24 hours. Gold added around 0.8% Monday morning and sits near record highs as Treasury Secretary Bessent's debt management strategy continued to weigh on long-dated yields — the 30-year bond yield briefly touched a 19-year high before the buyback announcement pulled it back. Bitcoin futures open interest declined to a two-month low of 715,000 BTC from the August 18 high of 762,000 BTC — the most analytically significant derivatives development of the session, confirming that last week's surge was driven by spot buying and short unwinding rather than leveraged bullish positioning.
Falling Open Interest Into a 24% Rally
Open interest declining from 762,000 BTC to a two-month low of 715,000 BTC while Bitcoin rallied 24% is the structural signature of a genuinely spot-driven advance rather than a leverage-fueled squeeze. In leveraged rallies, open interest rises as traders add new long positions — the price appreciation and the leverage build reinforce each other until the position becomes crowded and vulnerable to a liquidation cascade. In spot-driven rallies, open interest falls as existing short positions are closed and no new leveraged longs replace them — the buying is coming from participants purchasing actual Bitcoin rather than derivatives exposure.
The 47,000 BTC decline in open interest across the rally week — combined with the $3 billion in short liquidations — describes exactly this: shorts closing positions, reducing total open interest, while spot buyers absorbed the resulting demand without adding new leveraged exposure. ETH, SOL, and XRP futures revealed the same pattern of OI declines amid price rallies, confirming that the spot-driven dynamic extended across majors rather than being Bitcoin-specific.
This is the structurally healthiest configuration a rally can have. It directly addresses the sustainability question CryptoQuant raised when its 30-day apparent spot demand approached the zero-cross: whether the spot bid that emerged behind the squeeze holds once forced covering stops. Falling open interest into a rising price says the answer is yes — the buying is spot, not futures.
BVIV at 47% — Volatility Exploding Higher During a Rally
Bitcoin's 30-day implied volatility climbing to 47% annualized from 36% a week ago is an unusual configuration that deserves specific attention. The BVIV index is widely treated as a fear gauge that typically spikes during selloffs — implied volatility rising during a price rally is the exception rather than the rule. Ether's EVIV index surged similarly.
The rise from 36% to 47% during a 24% price advance reflects the market repricing the probability distribution of future outcomes rather than pricing fear. When Bitcoin was range-bound between $61,500 and $66,900 for six weeks, options markets could price a narrow distribution of likely outcomes — hence BVIV at multi-year lows of 35-36%. The breakout through $66,600, $70,000, $75,385, and $79,400 in five sessions widened that distribution dramatically: Bitcoin is now capable of moving in either direction with substantially more magnitude than the range period implied. Options sellers require higher premiums to underwrite that wider distribution regardless of direction.
For traders who followed TDX Strategies' December strangle recommendation at BVIV 35.59% lows, the move from 36% to 47% represents a significant mark-to-market gain on the volatility component of the position independent of the directional gain from Bitcoin's price advance. The article that noted implied volatility at 36% was 65% above realized volatility of 21.8% now has its resolution: realized volatility has caught up dramatically as the range broke, and implied volatility has expanded further to reflect the new regime.
ZEC — The Only Major With Rising OI Alongside Rising Price
Zcash's open interest climbing to 2.24 million tokens from 1.81 million a week ago — while its price rose over 70% — is the inverse of the pattern across BTC, ETH, SOL, and XRP, and it is the analytically stronger configuration for trend confirmation. Rising open interest alongside rising price means new capital is entering on the long side rather than shorts merely closing. The OI-adjusted weekly cumulative volume delta being the most positive among majors confirms that ZEC buyers have been leading price action through market orders rather than passive limit orders — aggressive directional conviction rather than opportunistic accumulation.
ZEC's 70% weekly gain with confirming OI growth makes it the strongest trend-confirmed move among major cryptocurrencies in the current rally. The privacy sector catching a bid alongside the broader risk-on move — with Monero having been August's earlier privacy outperformer — describes a rotation that predates the Treasury buyback catalyst and has now been amplified by it.
Funding Rates at 10% — No Signs of Overheating
Annualized funding rates for BTC, ETH, and other majors hovering around 10% describes a market with a bullish bias but nothing resembling the overheated positioning that historically precedes sharp reversals. In prior cycle tops, funding rates have reached 50-100% annualized as leveraged long demand became extreme. At 10%, longs are paying a modest premium to maintain positions — consistent with genuine directional interest rather than crowded speculation.
The 10% funding rate combined with falling open interest is the most constructive derivatives configuration available: bullish bias without leverage buildup, spot-driven price appreciation, and no crowded positioning vulnerable to a liquidation cascade. This is a materially different market structure than the 20-month high funding rates recorded just before the breakout — the rally has actually reduced the leverage risk rather than amplifying it, because shorts closing outweighed new longs opening.
Options — Cautious Optimism With the $70,000 Put Leading Volume
The Deribit call-put skew flipping positive at the front end — meaning short-dated calls are now pricier than puts — is the options market's confirmation of directional bullishness. But the 24-hour volume profile complicates that read: the $70,000 put topped the most active list, followed by call options. The combination describes cautious optimism rather than unrestrained bullishness — traders paying up for calls while simultaneously buying downside protection at $70,000, approximately 10% below spot.
The $70,000 put as the most active contract is analytically coherent given the rally's speed. Bitcoin moved from $62,600 to $79,400 in five sessions. A pullback to $70,000 would represent a normal retracement of roughly 40% of that advance — the kind of consolidation that follows any parabolic move. Traders buying $70,000 puts are hedging that scenario without abandoning their bullish directional positioning.
Altcoins Consolidating — Selective, Not Broad Rotation
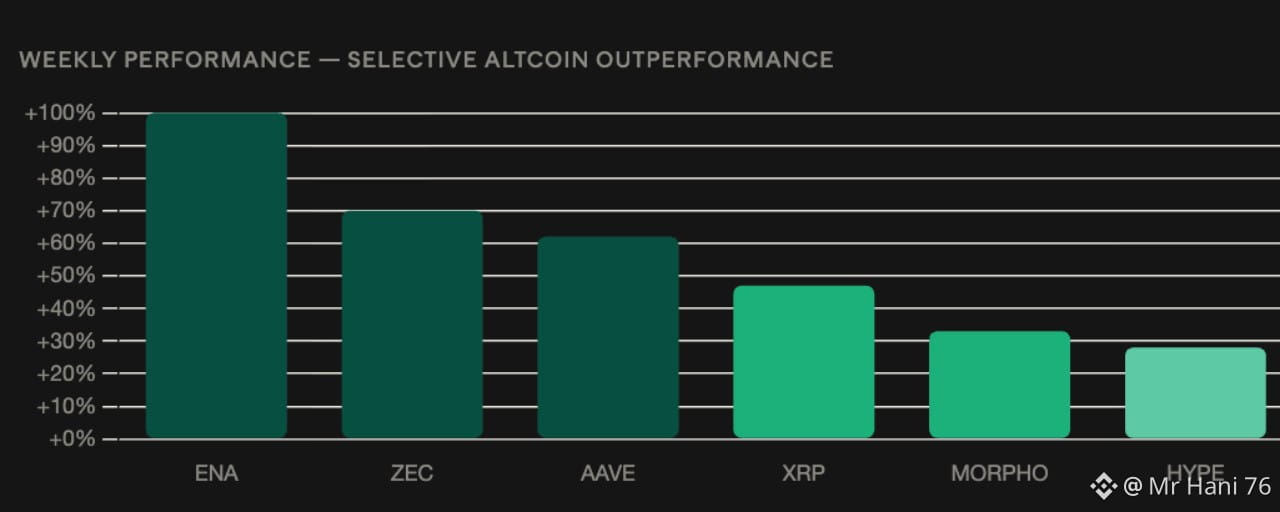
Bitcoin dominance holding near 59.2% with the Altcoin Season index at 42/100 — up from 33 on Friday but still firmly in Bitcoin territory — confirms that last week's altcoin outperformance was selective rather than a broad rotation. The standout performers had specific catalysts: ENA doubled to $1.79 following its $1 billion FalconX secured warehouse facility, AAVE rose more than 62% as DeFi tokens caught the broader risk-on bid, XRP gained 47% on the week, HYPE rose approximately 28% fueled in part by Trump's CFTC oversight comments before setting a record high of $83.30 late Sunday, and MORPHO gained 33% on the week.
Monday's pullbacks — HYPE down 3.3% to $79.59 from its record, XRP down 2.8% to $1.48, MORPHO down 6.2% to $2.73 despite holding an 18% 24-hour gain, AAVE easing 0.6% to $140.68 — are profit-taking after sharp runs rather than trend reversals. The Altcoin Season index rising from 33 to 42 while Bitcoin dominance holds at 59.2% describes the early stage of rotation rather than its completion: capital is beginning to move into altcoins but Bitcoin remains the dominant destination.
Gold Near Record Highs — the Parallel Trade Confirms the Macro Driver
Gold adding 0.8% Monday and sitting near record highs — with Bessent's debt management strategy continuing to weigh on long-dated yields after the 30-year briefly touched a 19-year high — confirms that the Treasury buyback catalyst is driving both gold and Bitcoin through the same channel. Both assets are responding to the reduced term premium pressure, the dollar weakness, and the sovereign risk repricing that the buyback announcement produced.
The gold-Bitcoin co-movement through a full week of the rally is the most sustained correlation between the two assets since the current cycle began — supporting the thesis that Bitcoin's institutional categorization may be shifting from purely liquidity-sensitive risk asset toward partial debasement hedge. Equities lagging while crypto and gold rallied in tandem is the specific relative performance signature that distinguishes a debasement trade from a general risk-on move.
Bài viết
Brent Giảm 1,87% Khi Bessent Cam Kết Cắt Đứt Các Đường Huyết Kinh Tế Của Iran Tin Tức BinanceTài khoản chính thức Binance đã được xác minh Theo dõi Nội dung đã được xác minh, không có bất kỳ sai lệch đáng kể nào trong bài đăng Giá dầu Brent giảm 1,87% xuống còn 92,63 USD vào hôm thứ Hai, trong khi WTI trượt 1,97% xuống còn 85,35 USD khi các nhà giao dịch cân nhắc chiến dịch gây sức ép ngày càng leo thang của Washington đối với Iran. Theo BeInCrypto, đợt bán tháo diễn ra sau khi cả hai chuẩn tham chiếu đều tăng hơn 5% trong tuần trước nhờ những lời lẽ leo thang, trong khi Bộ trưởng Tài chính Scott Bessent cho biết ngày “D-Day” kinh tế bắt đầu từ rạng sáng và Tổng thống Donald Trump tuyên bố sẽ áp dụng các biện pháp nhắm vào nền kinh tế Iran. OFAC trước đó đã phong tỏa hơn 130 triệu USD tiền điện tử liên quan đến Iran vào tháng Bảy.

Brent Giảm 1,87% Khi Bessent Cam Kết Cắt Đứt Các Đường Huyết Kinh Tế Của Iran Tin Tức Binance

Tài khoản chính thức Binance đã được xác minh
Theo dõi
Nội dung đã được xác minh, không có bất kỳ sai lệch đáng kể nào trong bài đăng
Giá dầu Brent giảm 1,87% xuống còn 92,63 USD vào hôm thứ Hai, trong khi WTI trượt 1,97% xuống còn 85,35 USD khi các nhà giao dịch cân nhắc chiến dịch gây sức ép ngày càng leo thang của Washington đối với Iran. Theo BeInCrypto, đợt bán tháo diễn ra sau khi cả hai chuẩn tham chiếu đều tăng hơn 5% trong tuần trước nhờ những lời lẽ leo thang, trong khi Bộ trưởng Tài chính Scott Bessent cho biết ngày “D-Day” kinh tế bắt đầu từ rạng sáng và Tổng thống Donald Trump tuyên bố sẽ áp dụng các biện pháp nhắm vào nền kinh tế Iran. OFAC trước đó đã phong tỏa hơn 130 triệu USD tiền điện tử liên quan đến Iran vào tháng Bảy.
Xem bản dịch
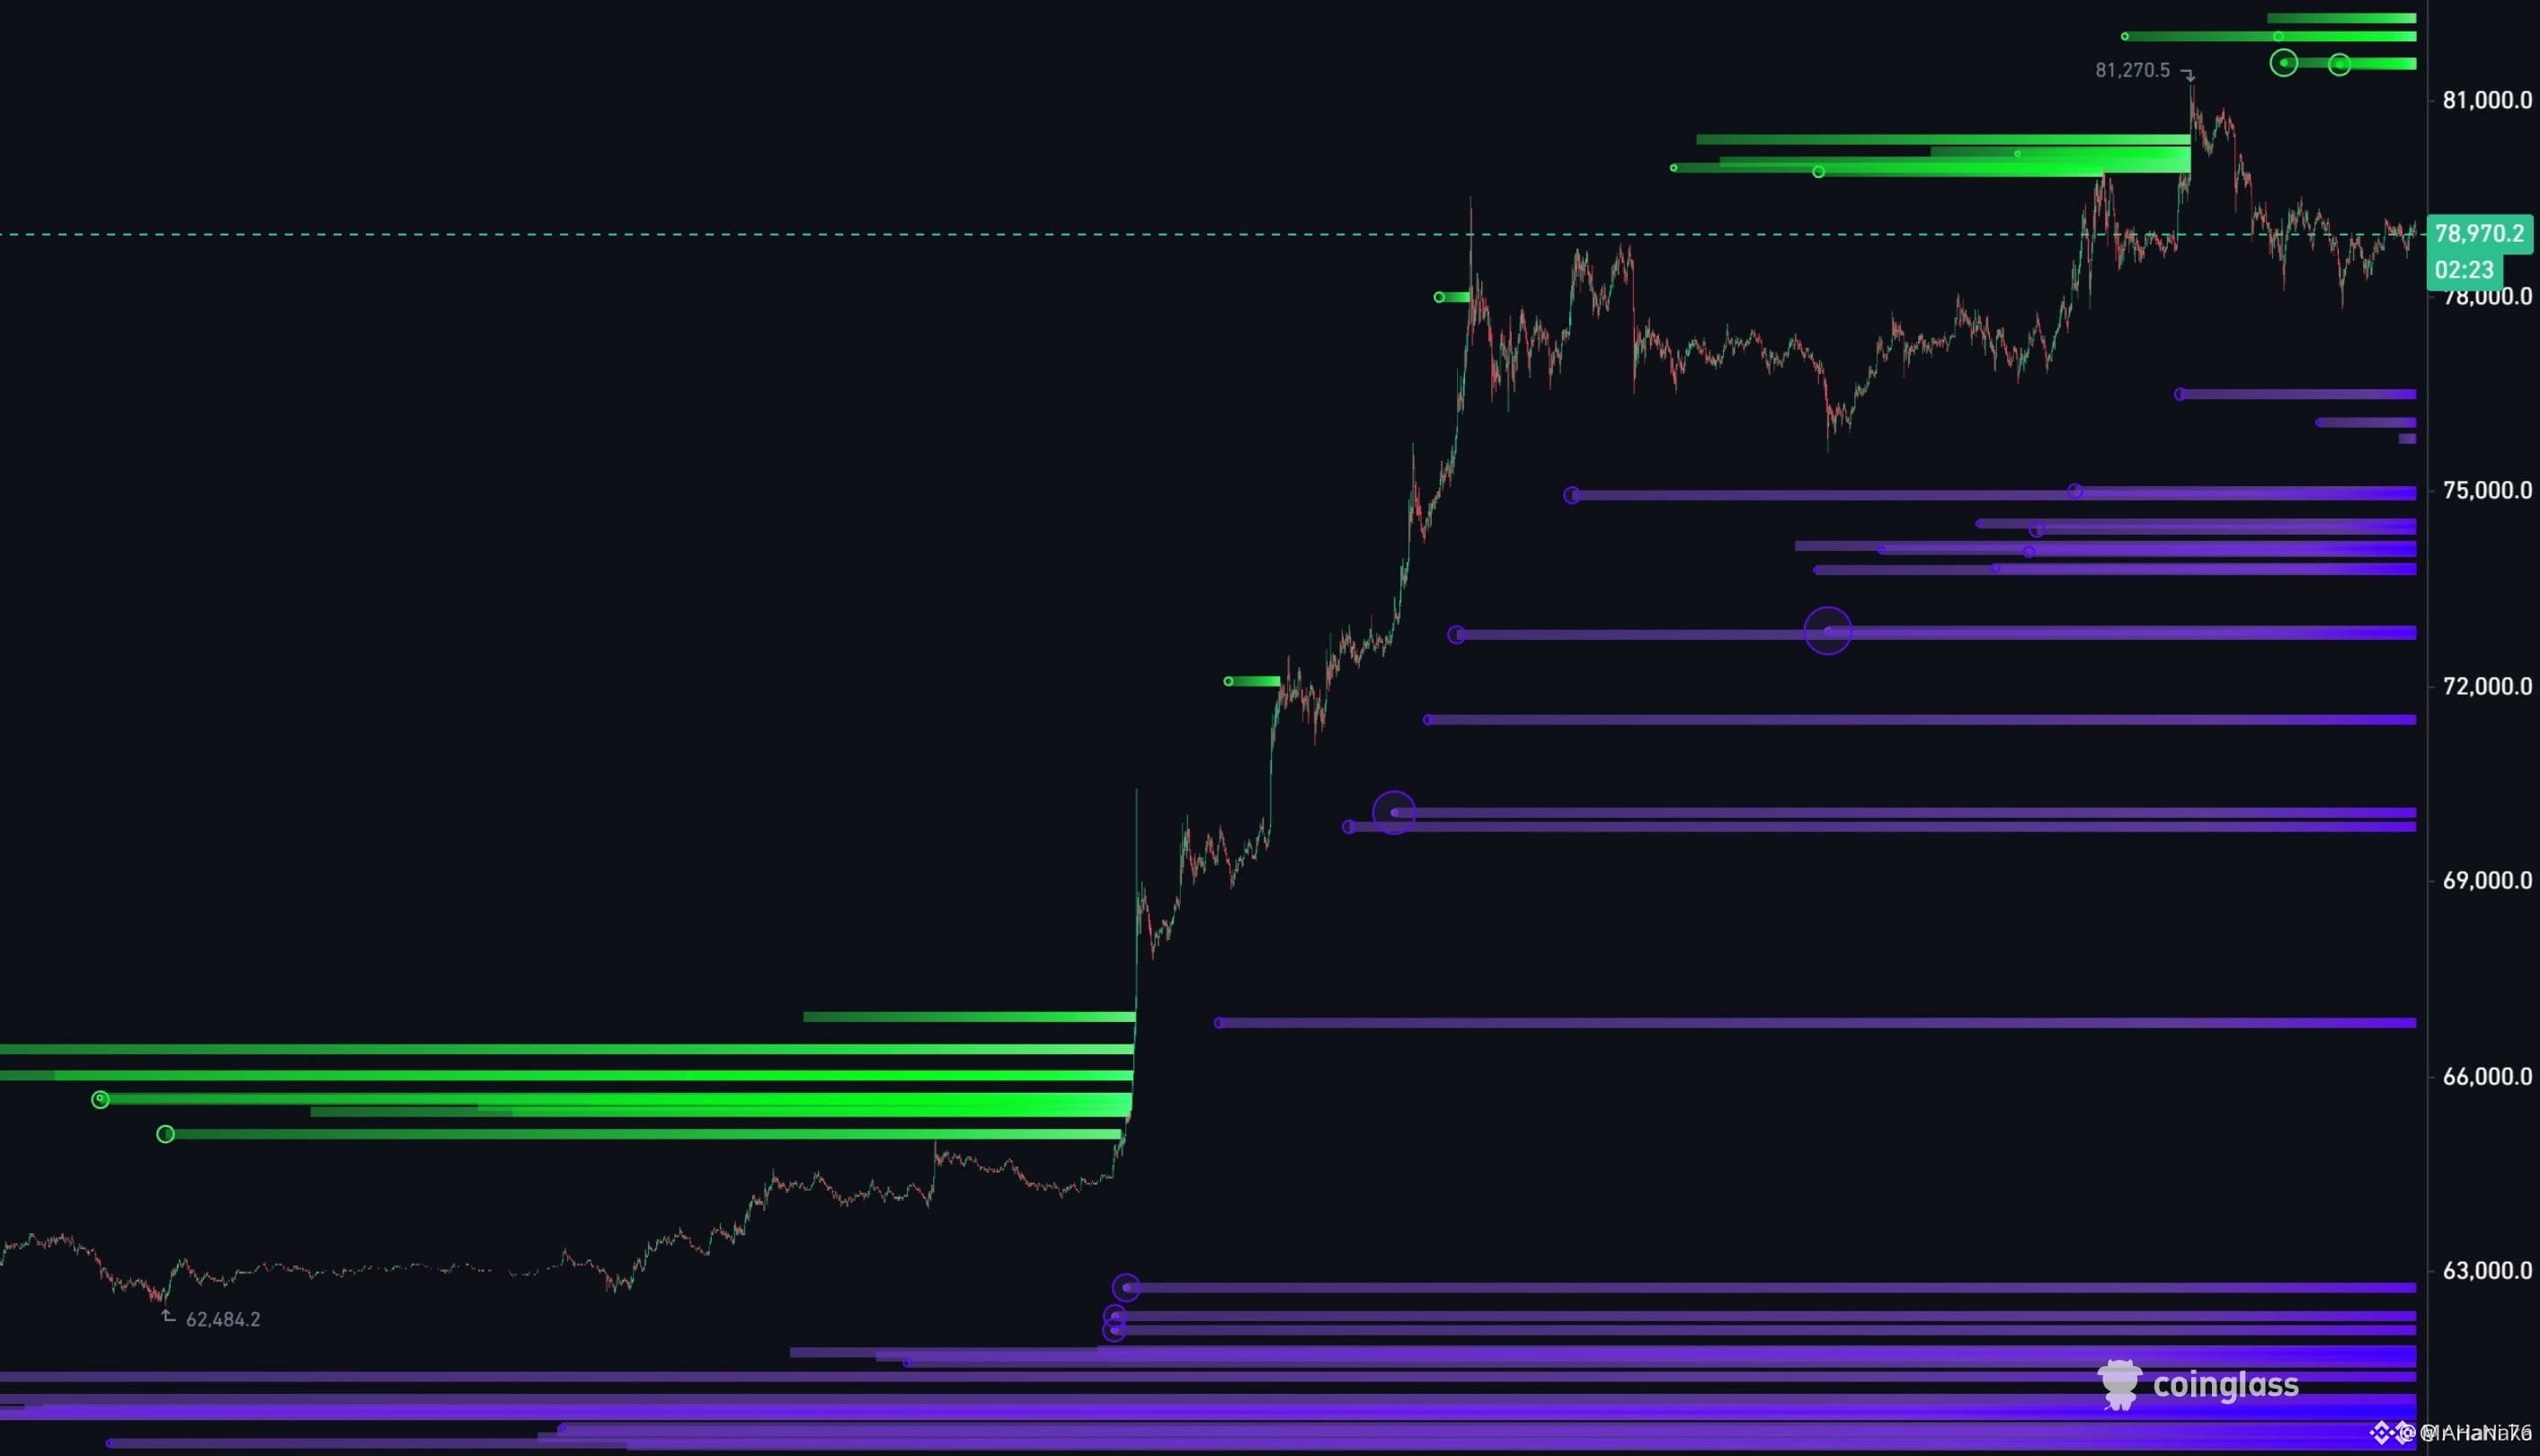
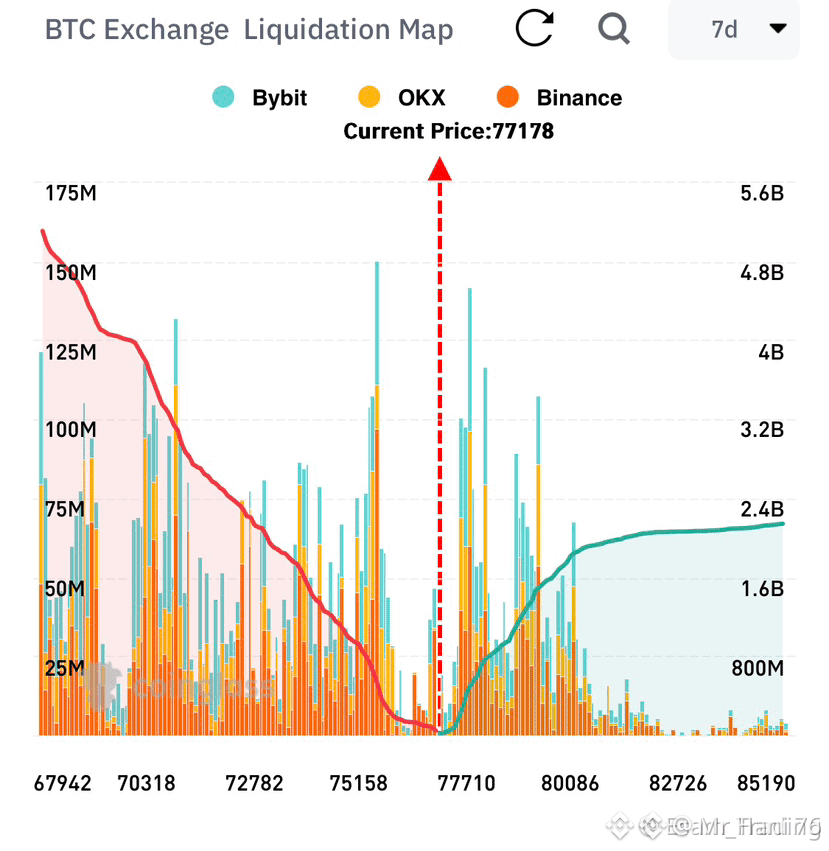
$BTC 7 days estimated liquidation data on three major exchanges: 1️⃣ Shorts Liquidity is piled upto 80k zone 2️⃣ Long Liquidity is piled upto 70k zone {spot}(BTCUSDT)
$BTC
7 days estimated liquidation data on three major exchanges:

1️⃣ Shorts Liquidity is piled upto 80k zone
2️⃣ Long Liquidity is piled upto 70k zone
Xem bản dịch
Bài viết
Xem bản dịch
Bài viết
Xem bản dịch
BTC$BTC is moving like crazy. 😂🚀 I’m fine with taking the risk, but Bitcoin just gained around $16,000 in a single week. Think about this: just four years ago, 1 BTC was trading around $15,500. Most people still don’t understand how explosive Bitcoin’s upside can become when momentum kicks in. 📈🔥 {spot}(BTCUSDT)

BTC

$BTC
is moving like crazy. 😂🚀
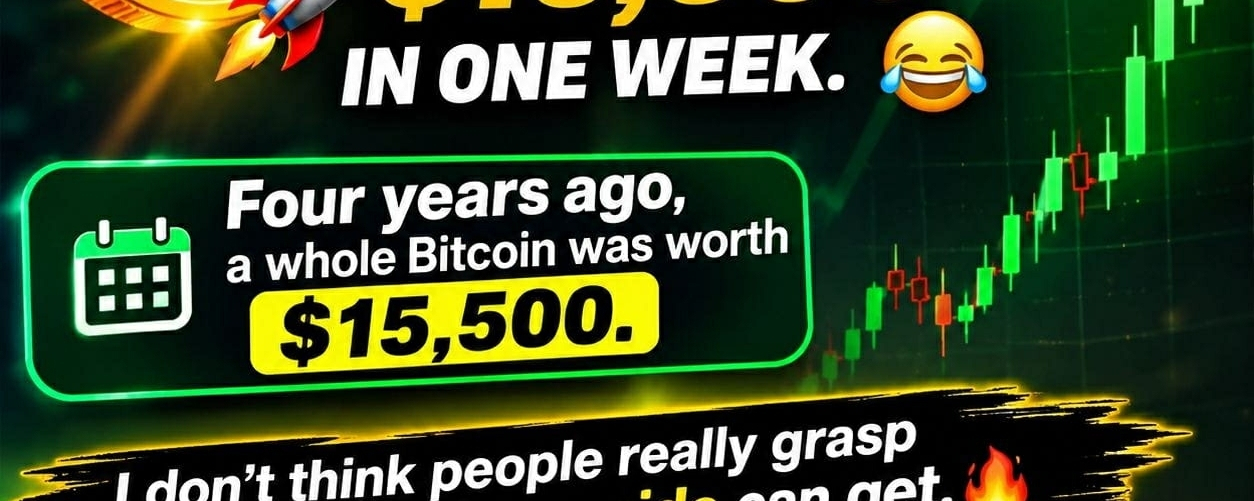
I’m fine with taking the risk, but Bitcoin just gained around $16,000 in a single week.
Think about this: just four years ago, 1 BTC was trading around $15,500.
Most people still don’t understand how explosive Bitcoin’s upside can become when momentum kicks in. 📈🔥
Xem bản dịch
🚀 $BTC JUST WENT CRAZY! Bitcoin has made a huge move from around $62K to nearly $79K, marking one of its strongest weekly performances in a long time . Right now,$BTC C is around $77K after touching nearly $78.8K in the last 24 hours. When you zoom out, the move looks even bigger — from roughly $57.8K to a peak near $82.8K before pulling back into the $70Ks. The interesting part is what’s driving this momentum: lower yields, a weaker dollar, changes in US Treasury buying activity, and fresh optimism around crypto regulation. Fear turned into Greed surprisingly fast. 📈🔥 And that small red move today? After such a sharp rally, BTC may simply be taking a breather. Now the big question: Is Bitcoin preparing for another breakout, or is it time for traders to take some profits? 👀 #Bitcoin #BTC #Crypto #CryptoMarket #Trading #Binance BTC 77,356.43 +0.07% {spot}(BTCUSDT)
🚀 $BTC JUST WENT CRAZY!

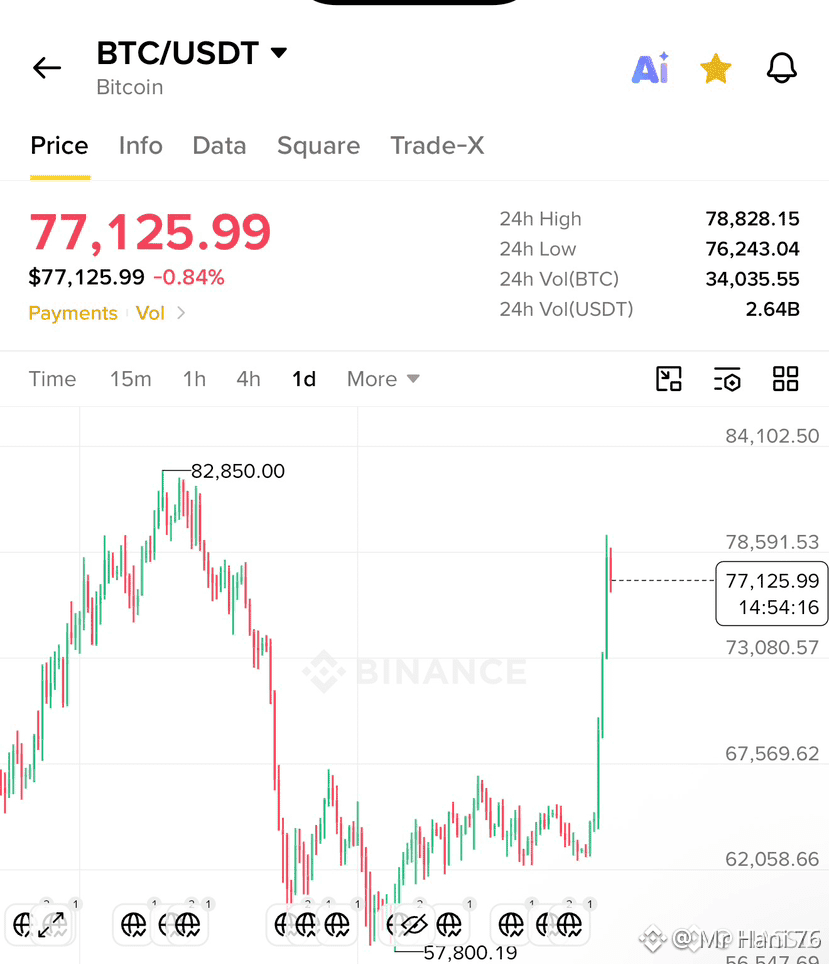
Bitcoin has made a huge move from around $62K to nearly $79K, marking one of its strongest weekly performances in a long time
.
Right now,$BTC C is around $77K after touching nearly $78.8K in the last 24 hours. When you zoom out, the move looks even bigger — from roughly $57.8K to a peak near $82.8K before pulling back into the $70Ks.

The interesting part is what’s driving this momentum: lower yields, a weaker dollar, changes in US Treasury buying activity, and fresh optimism around crypto regulation.

Fear turned into Greed surprisingly fast. 📈🔥
And that small red move today? After such a sharp rally, BTC may simply be taking a breather.

Now the big question: Is Bitcoin preparing for another breakout, or is it time for traders to take some profits? 👀
#Bitcoin #BTC #Crypto #CryptoMarket #Trading #Binance
BTC
77,356.43
+0.07%
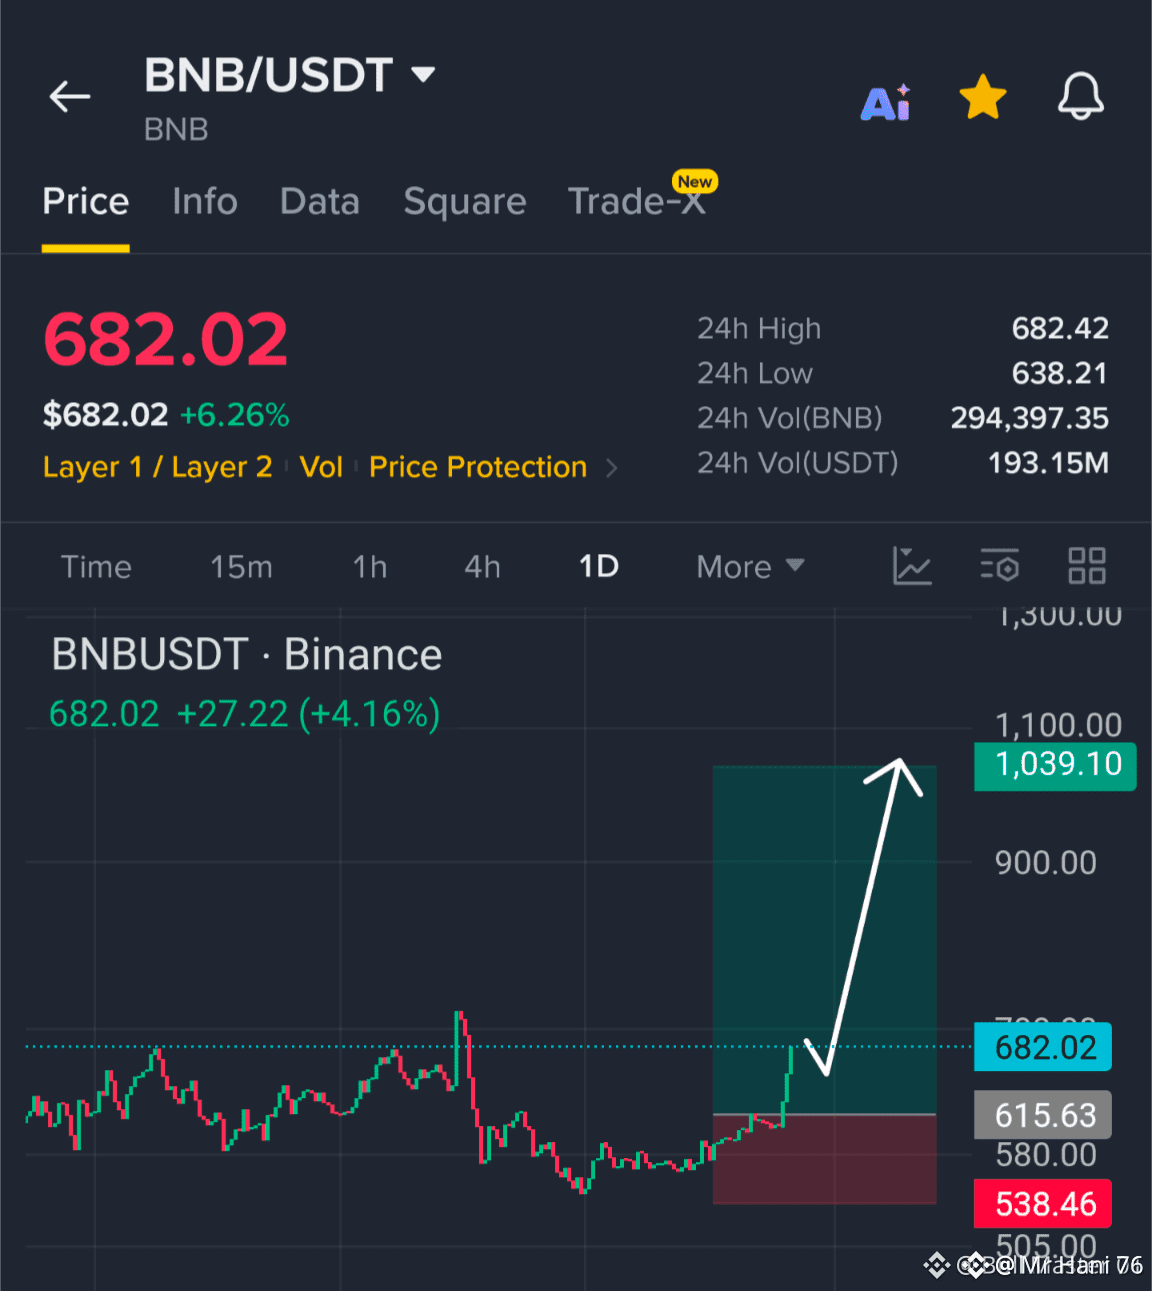
Mọi người ơi, mình đang mua $BNB từ từ, không mua một lần hết, nhưng mua một cách nhất quán. Mỗi lần giá điều chỉnh là một cơ hội. Mục tiêu của mình rất rõ ràng: $1100 . THIẾT LẬP GIAO DỊCH SPOT DÀI HẠN Vào lệnh: $682.02 TP: $750 / $850 / $1100 SL: $600 Đây không phải là một giao dịch ngắn hạn. Đây là vị thế dài hạn. BNB có nền tảng vững chắc, hệ sinh thái đang phát triển và động lực để có thể đẩy giá cao hơn nhiều trong chu kỳ này . Nếu bạn đang tìm một lệnh spot để nắm giữ vững chắc thì đây là một lựa chọn đáng cân nhắc. Mình đã vào lệnh. Cùng xây dựng với nhau nhé. Luôn tự nghiên cứu (DYOR) nhé ❤️ Mua tại đây 👉🏻 $BNB {spot}(BNBUSDT)
Mọi người ơi, mình đang mua $BNB từ từ, không mua một lần hết, nhưng mua một cách nhất quán.
Mỗi lần giá điều chỉnh là một cơ hội. Mục tiêu của mình rất rõ ràng: $1100
.
THIẾT LẬP GIAO DỊCH SPOT DÀI HẠN
Vào lệnh: $682.02
TP: $750 / $850 / $1100
SL: $600
Đây không phải là một giao dịch ngắn hạn. Đây là vị thế dài hạn. BNB có nền tảng vững chắc, hệ sinh thái đang phát triển và động lực để có thể đẩy giá cao hơn nhiều trong chu kỳ này
.
Nếu bạn đang tìm một lệnh spot để nắm giữ vững chắc thì đây là một lựa chọn đáng cân nhắc.
Mình đã vào lệnh. Cùng xây dựng với nhau nhé.
Luôn tự nghiên cứu (DYOR) nhé ❤️
Mua tại đây 👉🏻 $BNB
Xem bản dịch
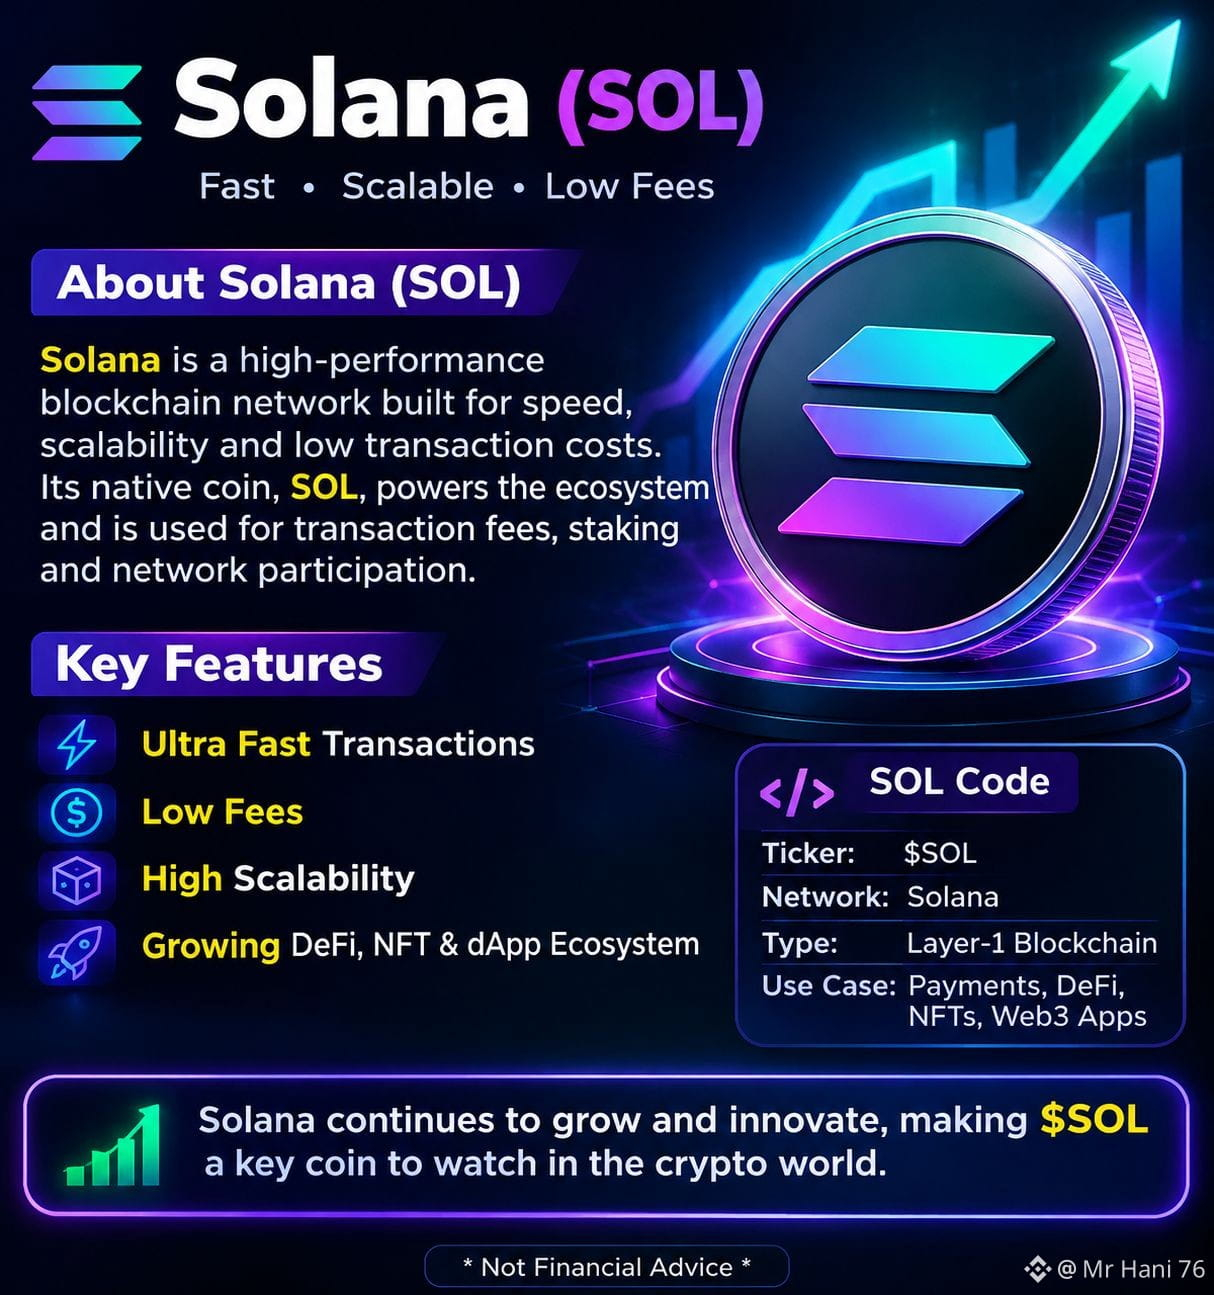
$SOL | Solana Update 🚀 Solana remains one of the strongest Layer-1 blockchain ecosystems, known for fast transactions and low fees. Its growing DeFi, NFT and payment ecosystem continues to attract users and developers. If network activity and adoption keep increasing, $SOL could remain a major coin to watch. 🔥 Coin: SOL Ticker: $SOL Network: Solana Type: Layer-1 Not financial advice. #USCanadaTradeTalksCollapseCanadaVowsRetaliation {spot}(SOLUSDT)
$SOL | Solana Update 🚀

Solana remains one of the strongest Layer-1 blockchain ecosystems, known for fast transactions and low fees. Its growing DeFi, NFT and payment ecosystem continues to attract users and

developers.
If network activity and adoption keep increasing,

$SOL could remain a major coin to watch. 🔥
Coin: SOL
Ticker: $SOL
Network: Solana
Type: Layer-1
Not financial advice.
#USCanadaTradeTalksCollapseCanadaVowsRetaliation
Đăng nhập để khám phá thêm nội dung
Tham gia cùng người dùng tiền mã hóa toàn cầu trên Binance Square
⚡️ Nhận thông tin mới nhất và hữu ích về tiền mã hóa.
💬 Được tin cậy bởi sàn giao dịch tiền mã hóa lớn nhất thế giới.
👍 Khám phá những thông tin chuyên sâu thực tế từ những nhà sáng tạo đã xác minh.
Email / Số điện thoại
Sơ đồ trang web
Tùy chọn Cookie
Điều khoản & Điều kiện