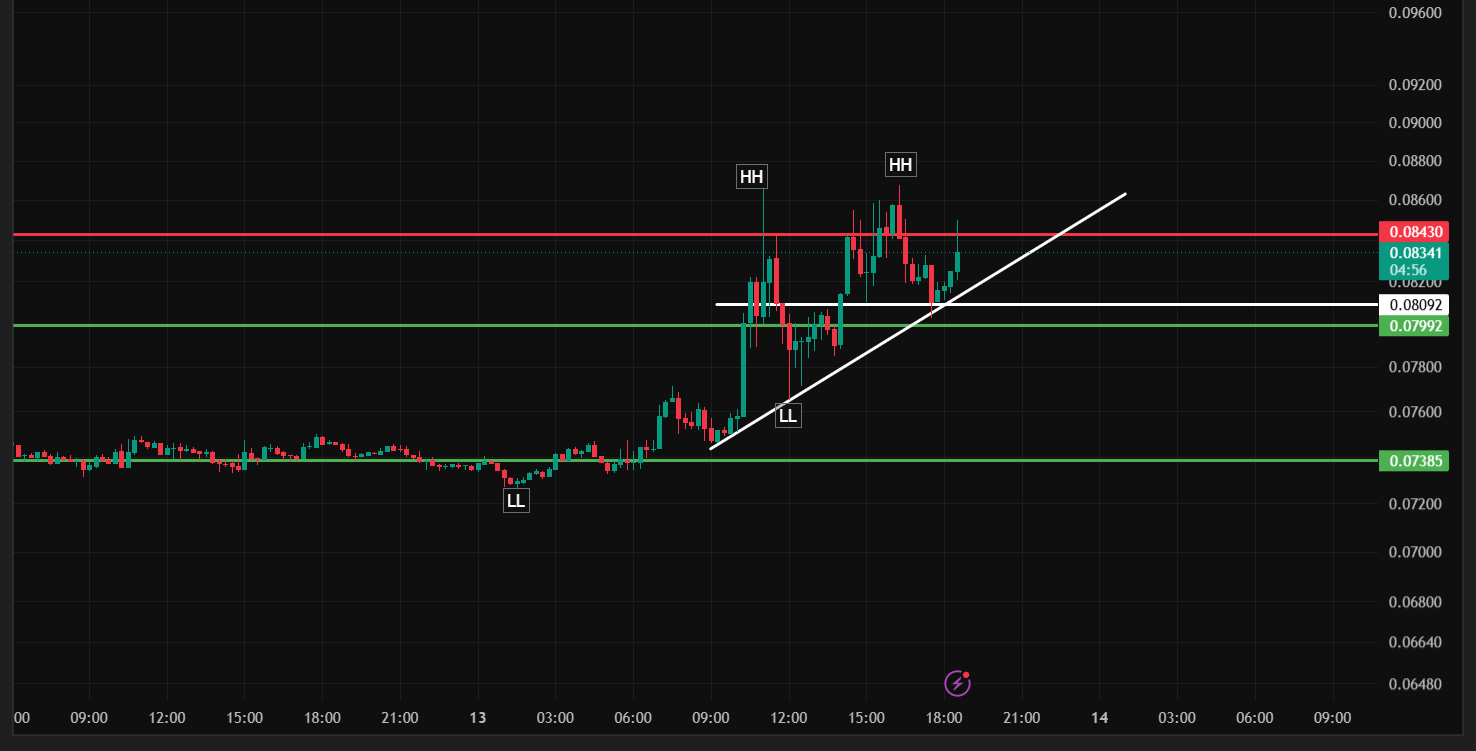


MYX/USDT Perpetual · 15-Minute Chart · Structure Break & Trendline Analysis
MYX spent over a day compressed in a tight base around $0.0737 before breaking out decisively on August 13, rallying sharply into a fresh high near $0.0843. Since that breakout, price has been consolidating just under resistance, building a rising trendline of Higher Lows and currently testing the same level for a second time at $0.08257.
Reading the Structure
The setup here is a textbook base-and-breakout: a long, quiet consolidation around $0.0737 finally gave way to a strong impulsive move, and the price action since has been constructive rather than choppy:
The breakout carried price directly into a fresh HH near $0.0843 (Aug 13 morning), the high of the entire move.
A pullback held at a Higher Low near $0.076 — well above the original base — before rallying back into a second test of the same $0.0843 resistance (Aug 13 afternoon).
Price has since settled into a tight consolidation around $0.08257, with a rising trendline connecting the Higher Low back to current price.
Testing the same resistance twice without a clean break isn't automatically bearish here — unlike some of the range-bound patterns in this batch, MYX's overall structure since the breakout has been one of Higher Lows building underneath resistance, which is generally a constructive sign that buyers are absorbing supply at the highs rather than losing interest.
Key Levels to Watch
Resistance:
$0.0843 — the level tested twice now; a confirmed close above this, ideally on strong volume, is what would actually validate a genuine breakout rather than a third failed attempt.
Support:
$0.08092 — first support, aligned with the current consolidation and the rising trendline.
$0.07992 — a slightly deeper support shelf just below.
$0.07385 — the origin of the entire breakout move; a break below this would undo the bullish structure built since August 13.
Trade Scenarios
Scenario A — Trendline pullback entry (aligned with the breakout):
Entry: On a hold/bounce in the $0.07992–0.08257 zone
Stop-loss: Below $0.07385
Target 1: $0.0843
Target 2: New highs beyond $0.0843, on a confirmed break
Scenario B — Breakout entry:
Entry: On a confirmed close above $0.0843 with real volume support — not just another wick through the level
Stop-loss: Below $0.08092
Target: New highs, trailed as price discovers
Scenario C — Deep retracement entry (conservative):
Entry: On a reaction/hold at $0.07385, the origin of the breakout
Stop-loss: Below $0.07385
Target 1: $0.08092
Target 2: $0.0843
What Would Change This Outlook
The rising trendline off the $0.076 Higher Low is the structural backbone of this consolidation, and as long as pullbacks continue to hold along it, the setup favors an eventual breakout over a failure. A genuine close above $0.0843 with volume confirmation would be the clearest signal of continuation. A break below $0.07385, however, would undo the entire breakout structure and suggest the move was a temporary spike rather than a sustained trend change.
Bottom Line
MYX has delivered a genuine breakout from an extended base and is now building a constructive Higher-Low pattern just beneath resistance. A hold above $0.07992–0.08092 keeps that structure intact, with a confirmed break above $0.0843 as the signal that this breakout has real room to extend.
This article is for informational and educational purposes only and does not constitute financial advice. Cryptocurrency trading, and perpetual futures contracts in particular, involve substantial risk of loss. Always do your own research and manage risk according to your own financial situation before making any trading decisions.
@Binance Square Official #USJulyCPI&PPIDueThisWeek #USJulyPPIFlat #SpaceXShortInterestFallsTo11% #Binance #ChartSniper