

BITCOIN OPEN INTEREST UPDATE
Bitcoin leverage is building again.
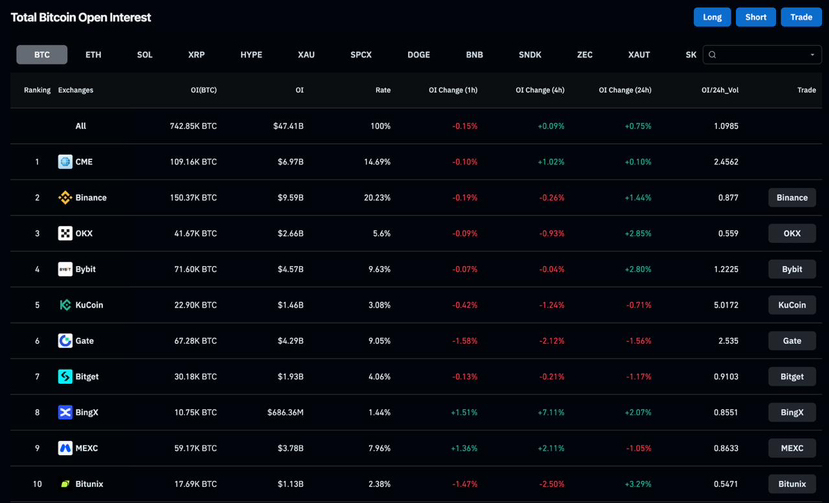
Total BTC open interest currently stands at $47.41B, with 742.85K BTC in outstanding futures contracts.
Over the past 24 hours, OI has increased +0.75% while Bitcoin remains around the $63K area.
The important part is the relationship between price and positioning.
OI is rising, but BTC has not made a significant move higher alongside it. This suggests traders are adding exposure ahead of the next directional move rather than the market already being in a strong trend.
Current data:
• Open interest: $47.41B
• Open contracts: 742.85K BTC
• 24H OI change: +0.75%
• 4H OI change: +0.09%
• 1H OI change: -0.15%
• OI / 24H volume: 1.10
Binance currently has the largest BTC OI at $9.59B, followed by CME at $6.97B and Bybit at $4.57B.
There is also an important longer-term point.
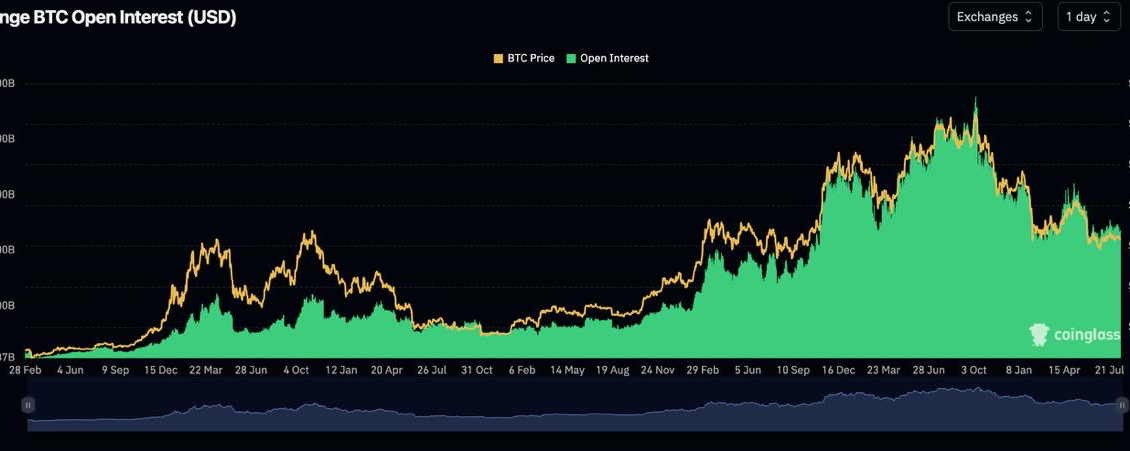
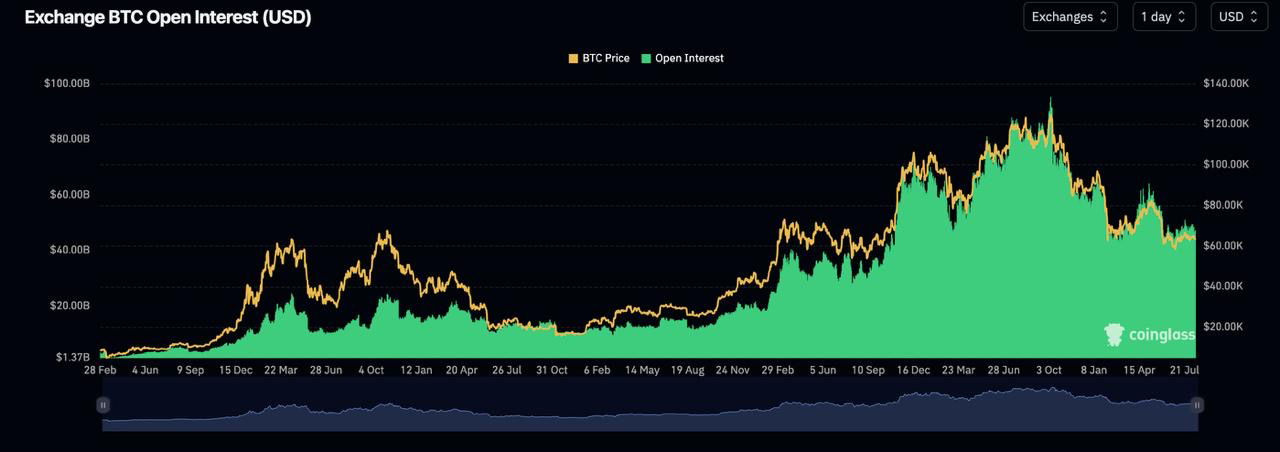
Current OI remains well below the $90B–$95B peak seen on the longer-term chart. So while leverage is rebuilding, the market is not yet showing the same degree of derivatives positioning seen during the previous OI expansion.
That makes the next move particularly important.
If BTC breaks higher while OI continues increasing, it would suggest fresh positioning is supporting the move.
If OI continues climbing while price remains trapped around $63K, the amount of leverage sitting inside the range will continue to increase, raising the potential for a sharper move once liquidity is triggered.
If price falls while OI remains elevated, we would be watching for long liquidations and a potential deleveraging event.
Our view:
The rise in OI is a signal to pay attention, not a directional signal by itself.
For now, the key question is whether this new positioning is followed by genuine spot demand and a breakout, or whether leverage continues building without price confirmation.
That distinction is likely to matter more than the OI number itself.
This framing is also consistent with how CoinGlass defines OI: it measures outstanding derivatives positions, and rising OI can reflect new positioning but does not tell us whether the market is net long or net short by itself.
I think this is stronger than the previous version because it gives readers the “so what?” immediately: $47.41B sounds huge in isolation, but the longer-term chart shows it is still substantially below the previous OI extreme.
That makes the current move look more like leverage rebuilding than an already-overheated derivatives market.