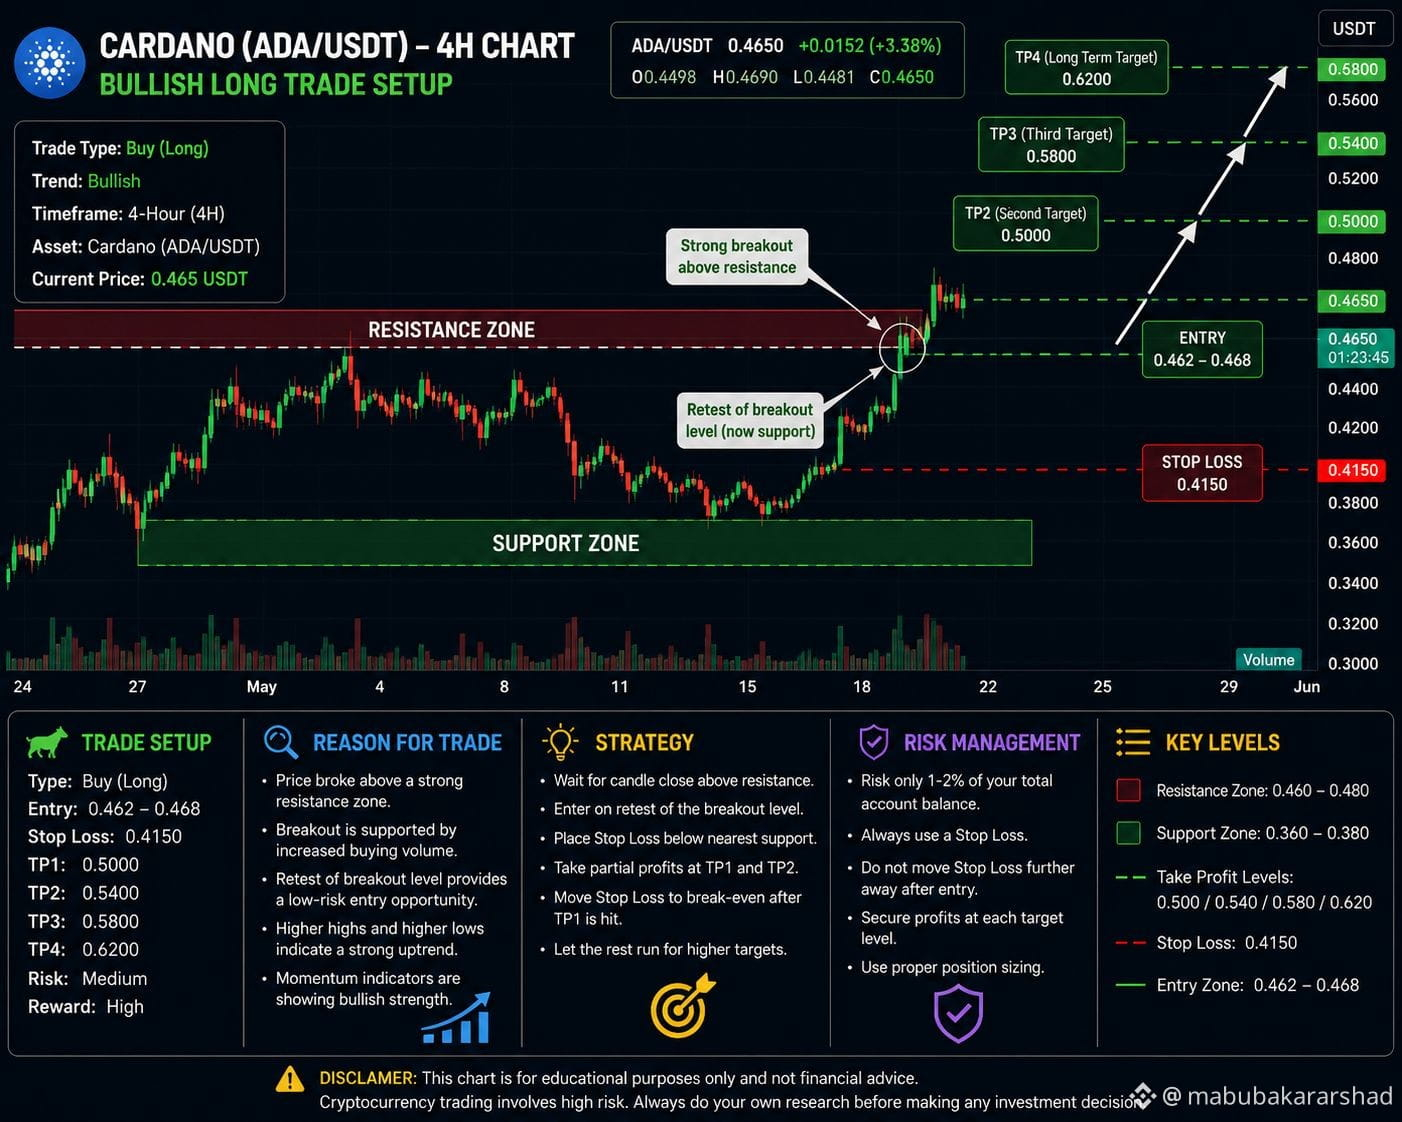
$ADA #ADABullish Tài sản: Cardano (ADA/USDT)
Khung thời gian: 4 giờ (4H)
Loại giao dịch: Mua (Long)
Xu hướng thị trường: Tăng
Kế hoạch giao dịch
Vùng vào lệnh: 0.462 – 0.468 USDT
Cắt lỗ: 0.415 USDT
TP1: 0.500 USDT
TP2: 0.540 USDT
TP3: 0.580 USDT
TP4 (Mục tiêu Long): 0.620 USDT
Vì sao giao dịch Long này?
Giá đã phá vỡ lên trên một vùng kháng cự quan trọng, cho thấy lực mua mạnh.
Việc kiểm tra lại (retest) vùng phá vỡ cho thấy kháng cự trước đây giờ đang đóng vai trò như hỗ trợ.
Biểu đồ tạo ra các Đỉnh Cao hơn (HH) và Đáy Cao hơn (HL), cho thấy xu hướng tăng.
Động lượng mua đang tăng lên, gợi ý khả năng đạt các mức mục tiêu cao hơn.
Chiến lược
Chờ một nến 4 giờ đóng cửa trên kháng cự trước khi vào lệnh.
Vào lệnh sau khi retest thành công vùng phá vỡ.
Giữ Cắt lỗ (Stop Loss) thấp hơn hỗ trợ gần nhất.
Chốt một phần lợi nhuận tại TP1 và TP2, và để phần còn lại chạy hướng tới TP3 và TP4.
Quản lý rủi ro
✅ Chỉ rủi ro 1–2% vốn giao dịch cho mỗi lệnh.
✅ Không bao giờ giao dịch mà không đặt Stop Loss.
✅ Dời Stop Loss về hòa vốn sau TP1 nếu giao dịch đi đúng hướng.
✅ Tránh vào lệnh trong các thời điểm tin tức có tác động lớn trừ khi chiến lược của bạn đã tính đến.
Các thuật ngữ giao dịch quan trọng
Entry (Vào lệnh): Giá nơi bạn mở giao dịch.
Stop Loss (SL): Mức giá bạn thoát ra để giới hạn thua lỗ.
Take Profit (TP): Các mức mục tiêu chốt lời.
Resistance (Kháng cự): Mức giá nơi lực bán mạnh.
Support (Hỗ trợ): Mức giá nơi lực mua mạnh.
Breakout (Phá vỡ): Khi giá vượt lên trên kháng cự với lực mạnh, thường cho thấy xu hướng tăng mới.
Tuyên bố miễn trừ: Thiết lập này chỉ nhằm mục đích giáo dục và không phải là lời khuyên tài chính. Thị trường tiền mã hóa biến động rất mạnh và không có giao dịch nào được đảm bảo sẽ đạt các mục tiêu. Luôn tự phân tích và sử dụng quản lý rủi ro phù hợp.#ADAAnalysis #BullRunTips #ChinaLaunchesBroadestTradeRetaliationOnUSFirms
Khung thời gian: 4 giờ (4H)
Loại giao dịch: Mua (Long)
Xu hướng thị trường: Tăng
Kế hoạch giao dịch
Vùng vào lệnh: 0.462 – 0.468 USDT
Cắt lỗ: 0.415 USDT
TP1: 0.500 USDT
TP2: 0.540 USDT
TP3: 0.580 USDT
TP4 (Mục tiêu Long): 0.620 USDT
Vì sao giao dịch Long này?
Giá đã phá vỡ lên trên một vùng kháng cự quan trọng, cho thấy lực mua mạnh.
Việc kiểm tra lại (retest) vùng phá vỡ cho thấy kháng cự trước đây giờ đang đóng vai trò như hỗ trợ.
Biểu đồ tạo ra các Đỉnh Cao hơn (HH) và Đáy Cao hơn (HL), cho thấy xu hướng tăng.
Động lượng mua đang tăng lên, gợi ý khả năng đạt các mức mục tiêu cao hơn.
Chiến lược
Chờ một nến 4 giờ đóng cửa trên kháng cự trước khi vào lệnh.
Vào lệnh sau khi retest thành công vùng phá vỡ.
Giữ Cắt lỗ (Stop Loss) thấp hơn hỗ trợ gần nhất.
Chốt một phần lợi nhuận tại TP1 và TP2, và để phần còn lại chạy hướng tới TP3 và TP4.
Quản lý rủi ro
✅ Chỉ rủi ro 1–2% vốn giao dịch cho mỗi lệnh.
✅ Không bao giờ giao dịch mà không đặt Stop Loss.
✅ Dời Stop Loss về hòa vốn sau TP1 nếu giao dịch đi đúng hướng.
✅ Tránh vào lệnh trong các thời điểm tin tức có tác động lớn trừ khi chiến lược của bạn đã tính đến.
Các thuật ngữ giao dịch quan trọng
Entry (Vào lệnh): Giá nơi bạn mở giao dịch.
Stop Loss (SL): Mức giá bạn thoát ra để giới hạn thua lỗ.
Take Profit (TP): Các mức mục tiêu chốt lời.
Resistance (Kháng cự): Mức giá nơi lực bán mạnh.
Support (Hỗ trợ): Mức giá nơi lực mua mạnh.
Breakout (Phá vỡ): Khi giá vượt lên trên kháng cự với lực mạnh, thường cho thấy xu hướng tăng mới.
Tuyên bố miễn trừ: Thiết lập này chỉ nhằm mục đích giáo dục và không phải là lời khuyên tài chính. Thị trường tiền mã hóa biến động rất mạnh và không có giao dịch nào được đảm bảo sẽ đạt các mục tiêu. Luôn tự phân tích và sử dụng quản lý rủi ro phù hợp.#ADAAnalysis #BullRunTips #ChinaLaunchesBroadestTradeRetaliationOnUSFirms