

Hi Everyone's Markets often reward those who can identify shifts in sentiment before they become obvious to everyone else. The past 24 hours have delivered two examples of assets that have captured buyer interest, though the nature of each rally tells a slightly different story. One token is climbing with a steady rhythm, while the other is pushing higher after absorbing significant selling pressure.
What makes these setups worth examining is the way each structure communicates the strength of its underlying demand. Both charts show upward movement, but the path taken and the levels being tested offer distinct clues about what might come next.
$HOME Steady Grind Higher
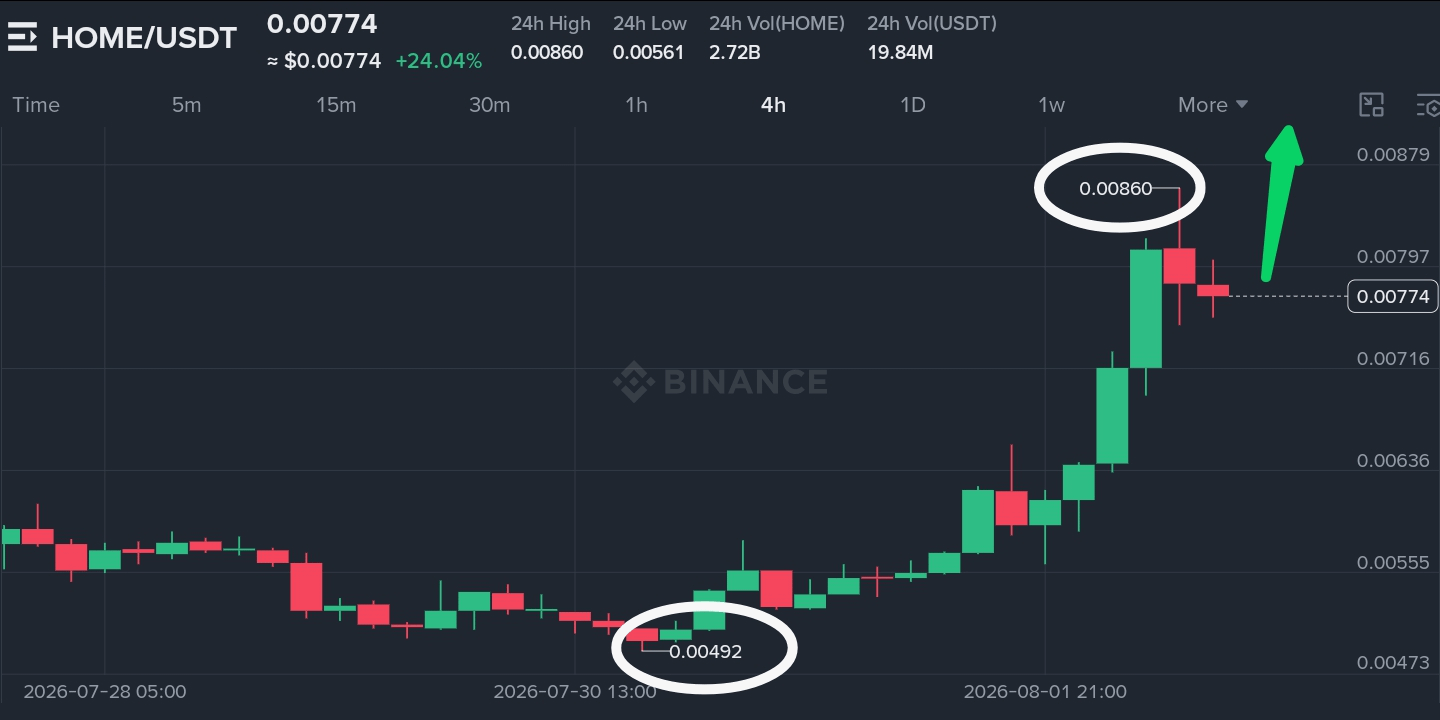
Home3 has been building a solid recovery from the 0.00473 swing low, with the current price of 0.00774 marking a significant move off those depths. The token has gained over 24% in the past 24 hours, reflecting sustained buying interest that has pushed price through multiple resistance levels. The 24-hour high of 0.00860 and the visible swing high of 0.00879 form the immediate ceiling above.
The structure shows a clear upward trajectory with price breaking through the 0.00636 and 0.00716 levels along the way. The current price sits above the 0.00797 level, which now acts as potential support. The 0.00860 level represents the next hurdle before the 0.00879 resistance comes into play. The token has experienced increased trading volume and price surges recently, which aligns with the visible uptrend.
What spot traders are watching is whether HOME can sustain above 0.00774 and challenge the 0.00860-0.00879 zone. The 24-hour volume of 2.72 billion HOME and 19.84 million USDT indicates robust participation, and the steady climb suggests that buyers remain in control without being overly aggressive. This measured approach often leads to more sustainable moves compared to explosive rallies.
Current Price: 0.00774
Primary Base Zone: 0.00636 to 0.00774
Primary Ceiling Zone: 0.00860 to 0.00879
The base zone reflects the levels that price has built upon during the recovery. Confidence in this structure would increase if price can hold above 0.00774 and push toward the 0.00860 resistance. The structure is weakened by the proximity to overhead supply near the 0.00879 level, which could attract selling pressure if approached without sufficient momentum.
Spot Outlook:
HOME remains in a recovery phase with momentum intact. The key level to watch is 0.00774—holding above that keeps the uptrend alive, while a break below would open the door to a retest of the 0.00716 area.

$HYPER Breakout Consolidation Phase
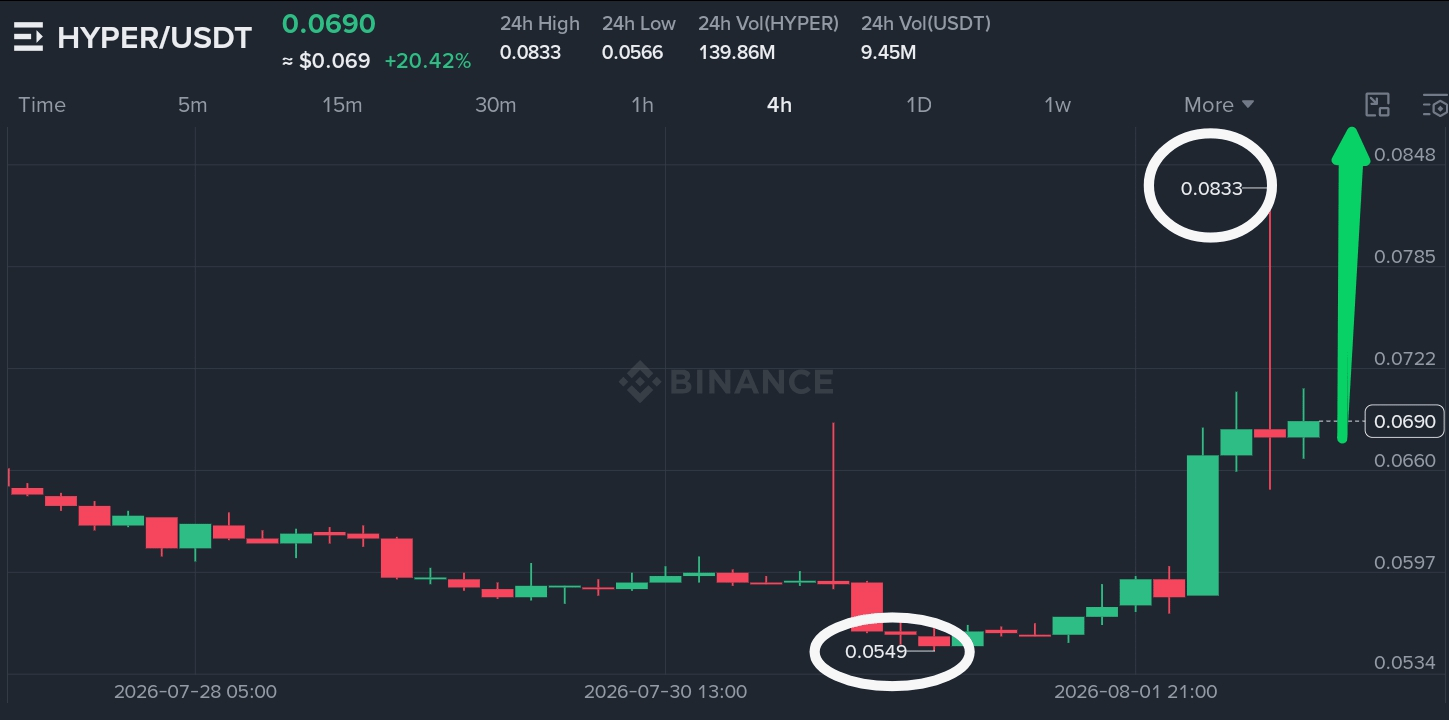
HyperCycle presents a slightly different picture. The token has surged from a low of 0.0566 to a current price of 0.0690, with the 24-hour high of 0.0833 and the visible swing high of 0.0848 forming the resistance zone above. The move represents a recovery from the 0.0534 swing low, with price breaking through the 0.0597 and 0.0660 levels along the way.
The chart reveals a pattern of higher lows, with the 0.0660 level now acting as potential support. The current price of 0.0690 sits above the 0.0722 level, which has become a pivot point. How price behaves around this area will determine whether the breakout has staying power or if a pullback is likely. The token has seen a significant spike in price recently, reflecting strong buyer interest.
What traders are observing is whether HYPER can consolidate above 0.0690 and build a base for a move toward the 0.0833-0.0848 zone. The 24-hour volume of 139.86 million HYPER and 9.45 million USDT suggests active participation, and the sharp rally indicates that buyers are stepping in with conviction. The 0.0848 level represents the highest visible resistance, and a move above that would signal a continuation of the uptrend.
Current Price: 0.0690
Primary Base Zone: 0.0660 to 0.0690
Primary Ceiling Zone: 0.0833 to 0.0848
The base zone reflects the levels that price is currently consolidating above. The structure would gain strength if price holds above 0.0690 and builds momentum toward the 0.0833 resistance. It would weaken if the consolidation breaks to the downside, leading to a potential retest of the 0.0597 level.
Spot Outlook:
HYPER is in a consolidation phase after a sharp rally. The most probable scenario is continued range-bound action near current levels unless buyers can generate enough momentum to clear the 0.0833 barrier.

Quick Comparison
First Chart
• Trend: Steady recovery from 0.00473 low, building higher lows
• Primary Base Zone: 0.00636 to 0.00774
• Primary Ceiling Zone: 0.00860 to 0.00879
• Trading Style: Measured climb, requires confirmation of support
• Exposure Factor: Moderate—momentum is intact but resistance is near
Second Chart
• Trend: Breakout from 0.0534 low, currently consolidating
• Primary Base Zone: 0.0660 to 0.0690
• Primary Ceiling Zone: 0.0833 to 0.0848
• Trading Style: Breakout consolidation, requires continuation confirmation
• Exposure Factor: Higher—volatility is elevated and resistance is significant
Risk Management
Position sizing takes on different importance in each setup. For HOME, the steady climb offers a more controlled structure, but the resistance zone at 0.00860-0.00879 is clearly defined and could cap further gains. For HYPER, the breakout and consolidation phase offers potential upside but comes with the risk of a deeper pullback given the sharpness of the initial rally. In both cases, waiting for price to confirm its next move is more prudent than anticipating it. For HOME, a break below 0.00716 would signal that momentum is fading; for HYPER, a break above 0.0833 would provide the necessary clarity for a potential continuation.
Final Take
These two charts capture different phases of upward momentum. #Home is demonstrating what a steady recovery looks like, with price gradually building a foundation for a potential move higher. #HYPER is showing what happens after a sharp breakout, with price consolidating near recent highs and preparing for the next directional move. One offers the possibility of continued measured ascent; the other presents a test of whether the breakout has staying power. Neither provides certainty, but both offer the kind of structural clarity that forms the basis of sound trading decisions.
Which of these two scenarios do you find more aligned with your spot trading approach—the steady measured climb or the breakout consolidation phase?