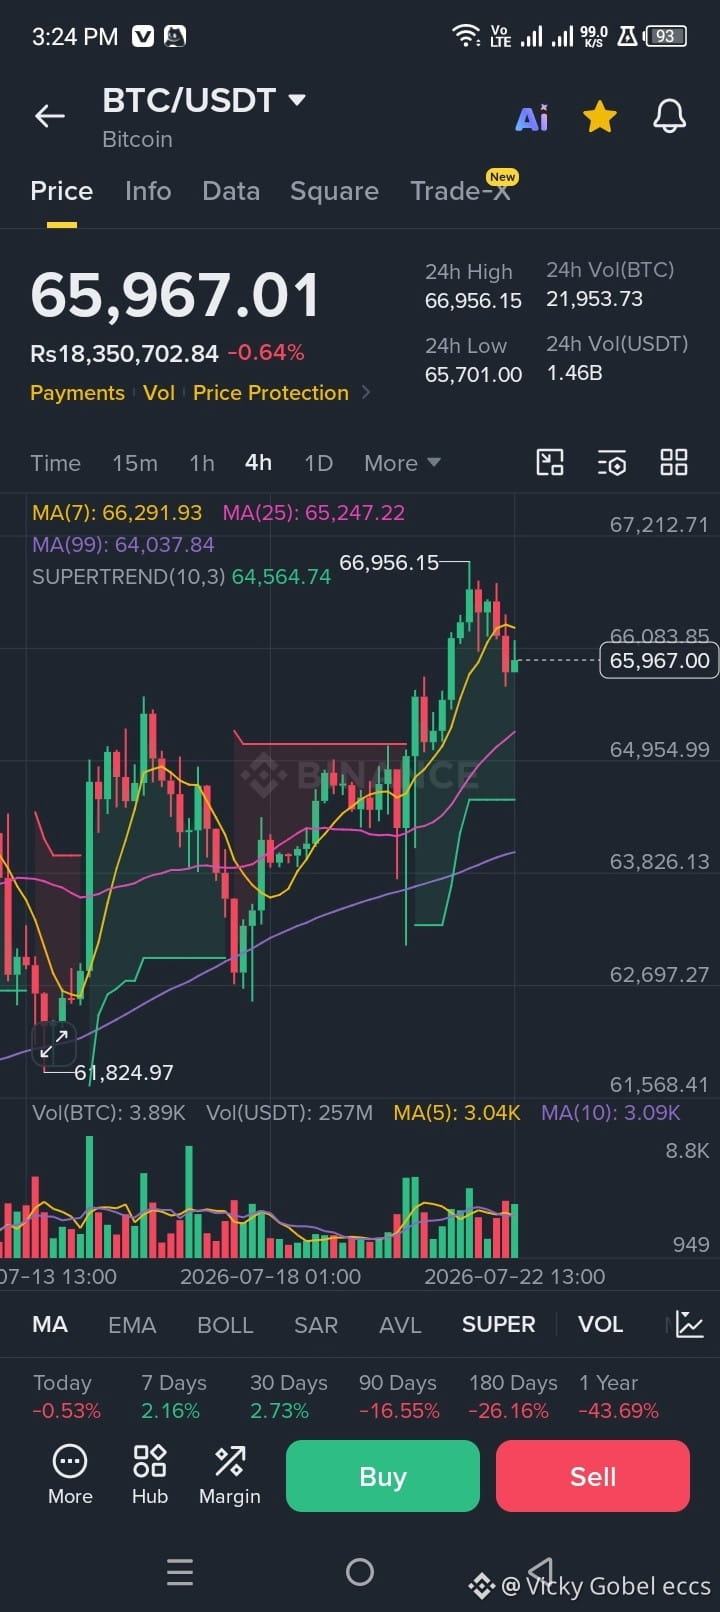
Here is the technical analysis for the $BTC/USDT 4-hour chart shown in your image.
📊 Technical Analysis (4-Hour Timeframe)
1. Bullish Signals (Upward Momentum Factors)
* Bullish Structure: $Bitcoin recently pushed up strongly from the 61,824.97 level, reaching a high of 66,956.15.
* Supertrend Indicator: The SUPERTREND (10,3) line remains green at 64,564.74, indicating the medium-term uptrend remains intact.
* Moving Average Alignment:
* MA(25) at 65,247.22 and MA(99) at 64,037.84 are both well below the current price, acting as dynamic support zones.
2. Bearish Signals (Short-Term Pressure)
* Rejection at Resistance: $BTC faced strong seller pressure near 67,000, leaving a upper wick on the recent high at 66,956.15.
* Short-Term Pullback: The current price (65,967.01) has dropped below the short-term MA(7) at 66,291.93, indicating minor pullback or profit-taking.
🔮 Future Price Scenarios
Scenario A: Bullish Continuation (Higher Probability)
If BTC holds above the 65,000 – 65,250 area (near MA25):
* Target 1: 66,956.15 (Recent Local High)
* Target 2: 67,212.00 – 68,000.00 (Key Resistance Zone)
Scenario B: Bearish / Deeper Correction
If $BTC breaks down below 65,247 (MA25):
* Support 1: 64,564.74 (Supertrend Green Line)
* Support 2: 64,037.84 (MA99 Support)
💡 Summary
* Short-Term (Next few hours): Slight downward/sideways consolidation as it tests immediate support near $65,500.
* Medium-Term Outlook: Bullish, provided Bitcoin holds above the $64,500 - $65,200 support region.
>
⚠️ Disclaimer: Crypto trading carries high market risk. Always use a Stop Loss and manage your risk carefully.
>
#HongKongStorageStocksStrengthen CircleDrives$330MStablecoinInflowsToSolanaBitcoinHits$66500OneMonthHigh
📊 Technical Analysis (4-Hour Timeframe)
1. Bullish Signals (Upward Momentum Factors)
* Bullish Structure: $Bitcoin recently pushed up strongly from the 61,824.97 level, reaching a high of 66,956.15.
* Supertrend Indicator: The SUPERTREND (10,3) line remains green at 64,564.74, indicating the medium-term uptrend remains intact.
* Moving Average Alignment:
* MA(25) at 65,247.22 and MA(99) at 64,037.84 are both well below the current price, acting as dynamic support zones.
2. Bearish Signals (Short-Term Pressure)
* Rejection at Resistance: $BTC faced strong seller pressure near 67,000, leaving a upper wick on the recent high at 66,956.15.
* Short-Term Pullback: The current price (65,967.01) has dropped below the short-term MA(7) at 66,291.93, indicating minor pullback or profit-taking.
🔮 Future Price Scenarios
Scenario A: Bullish Continuation (Higher Probability)
If BTC holds above the 65,000 – 65,250 area (near MA25):
* Target 1: 66,956.15 (Recent Local High)
* Target 2: 67,212.00 – 68,000.00 (Key Resistance Zone)
Scenario B: Bearish / Deeper Correction
If $BTC breaks down below 65,247 (MA25):
* Support 1: 64,564.74 (Supertrend Green Line)
* Support 2: 64,037.84 (MA99 Support)
💡 Summary
* Short-Term (Next few hours): Slight downward/sideways consolidation as it tests immediate support near $65,500.
* Medium-Term Outlook: Bullish, provided Bitcoin holds above the $64,500 - $65,200 support region.
>
⚠️ Disclaimer: Crypto trading carries high market risk. Always use a Stop Loss and manage your risk carefully.
>
#HongKongStorageStocksStrengthen CircleDrives$330MStablecoinInflowsToSolanaBitcoinHits$66500OneMonthHigh