$PEPE Coin (PEPE/USDT) Phân tích Kỹ thuật: Ngày 10 tháng 5 năm 2026
Thị trường memecoin hôm nay đang nóng lên, và $PEPE đang dẫn đầu với mức biến động đáng kể. Sau khi retest thành công một mức hỗ trợ lịch sử quan trọng, PEPE đã bước vào một làn sóng xung lực dữ dội, sẵn sàng cho một cú bứt phá mạnh hoặc bị từ chối quyết liệt.
Các Chỉ Báo Kỹ Thuật & Điểm Trên Biểu Đồ:
Động Lượng Giá Hiện Tại (Rất Tích Cực):
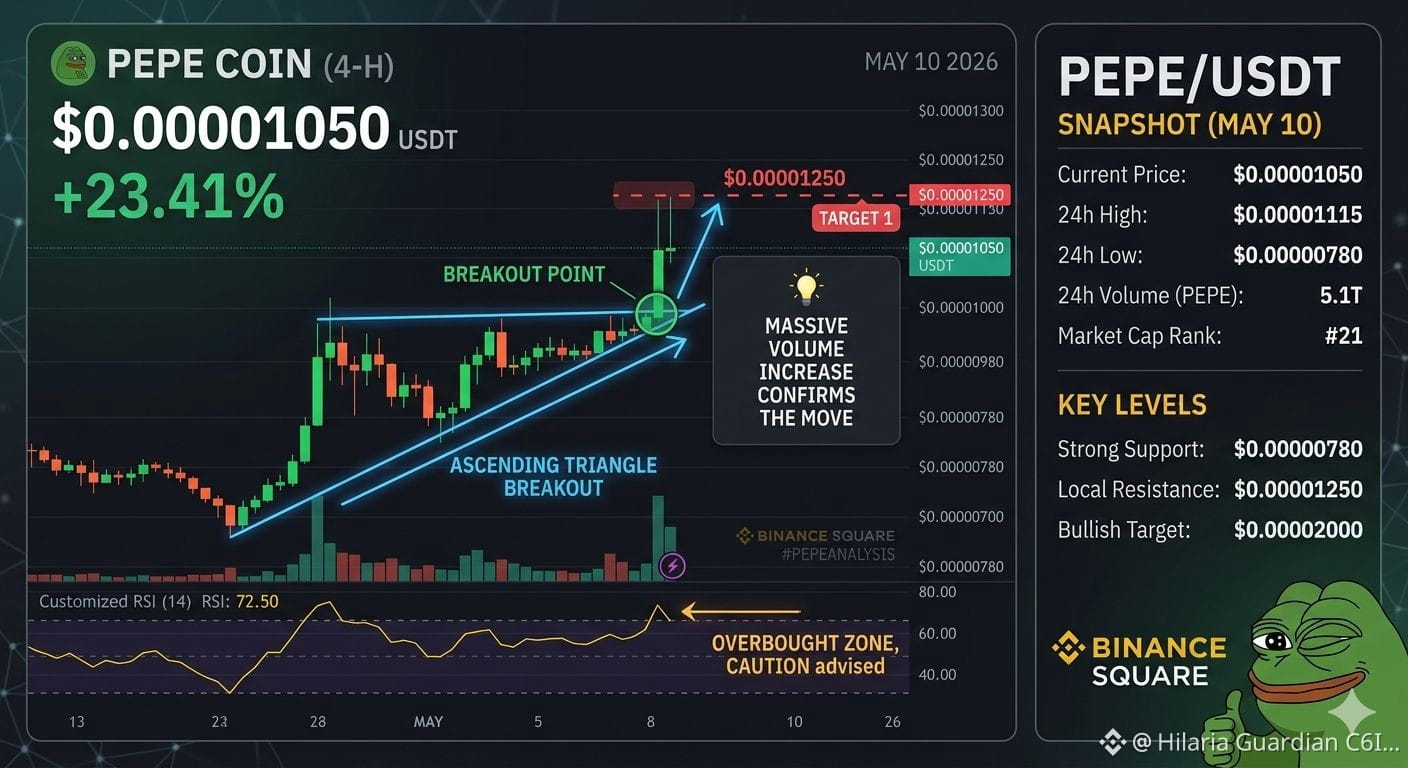
Như thể hiện trên infographic, PEPE đang giao dịch gần đỉnh cục bộ quan trọng ở mức $0.00001050 (USDT), ghi nhận mức tăng đáng kể +23,41% trong 24 giờ qua. Nến xanh lớn, chiếm ưu thế xác nhận lực mua mạnh mẽ.
Xác Nhận Bứt Phá (Tam Giác Tăng):
Biểu đồ cho thấy Bứt Phá Tam Giác Tăng. PEPE đã tích lũy trong nhiều ngày, hình thành các đáy cao dần (đường xanh lam xiên) so với một đường kháng cự ngang. Cây nến xanh khổng lồ gần đây đã cắt sạch qua ngưỡng kháng cự đó, cho thấy giai đoạn tích lũy đã kết thúc.
Xác Nhận Bằng Khối Lượng:
Điều quan trọng là, đợt bứt phá này được hỗ trợ bởi sự gia tăng mạnh mẽ về khối lượng giao dịch. Hãy chú ý đến đột biến khối lượng xanh lớn tương ứng chính xác với pha nhảy giá. Điều này xác nhận cho động thái đó.
Diễn biến hôm nay trên $PEPE là rất tích cực đối với phe bull. Đợt bứt phá về mặt kỹ thuật diễn ra gọn gàng, được hậu thuẫn bởi khối lượng lớn. Hiện tại, chúng tôi đang tìm kiếm một phiên đóng cửa theo ngày trên vùng $0.00001050 để xác nhận rằng đợt tăng hướng tới mục tiêu $0.00001250 là sắp đến. Như mọi khi với các tài sản có biến động cao, quản lý rủi ro chặt chẽ là điều thiết yếu.
Phân tích này chỉ nhằm mục đích cung cấp thông tin và không nên được xem là lời khuyên tài chính.
Dưới đây là infographic phân tích biểu đồ chuyên nghiệp dành cho bài đăng Binance Square của bạn:
CFTC&SECStrengthenOversightCollaborationOnPredictionMarkets.
#CLARITYActHearingSetforMay14
#USAdds115kJobs #JapanOnchainBondsand24/7Trading
Thị trường memecoin hôm nay đang nóng lên, và $PEPE đang dẫn đầu với mức biến động đáng kể. Sau khi retest thành công một mức hỗ trợ lịch sử quan trọng, PEPE đã bước vào một làn sóng xung lực dữ dội, sẵn sàng cho một cú bứt phá mạnh hoặc bị từ chối quyết liệt.
Các Chỉ Báo Kỹ Thuật & Điểm Trên Biểu Đồ:
Động Lượng Giá Hiện Tại (Rất Tích Cực):
Như thể hiện trên infographic, PEPE đang giao dịch gần đỉnh cục bộ quan trọng ở mức $0.00001050 (USDT), ghi nhận mức tăng đáng kể +23,41% trong 24 giờ qua. Nến xanh lớn, chiếm ưu thế xác nhận lực mua mạnh mẽ.
Xác Nhận Bứt Phá (Tam Giác Tăng):
Biểu đồ cho thấy Bứt Phá Tam Giác Tăng. PEPE đã tích lũy trong nhiều ngày, hình thành các đáy cao dần (đường xanh lam xiên) so với một đường kháng cự ngang. Cây nến xanh khổng lồ gần đây đã cắt sạch qua ngưỡng kháng cự đó, cho thấy giai đoạn tích lũy đã kết thúc.
Xác Nhận Bằng Khối Lượng:
Điều quan trọng là, đợt bứt phá này được hỗ trợ bởi sự gia tăng mạnh mẽ về khối lượng giao dịch. Hãy chú ý đến đột biến khối lượng xanh lớn tương ứng chính xác với pha nhảy giá. Điều này xác nhận cho động thái đó.
Diễn biến hôm nay trên $PEPE là rất tích cực đối với phe bull. Đợt bứt phá về mặt kỹ thuật diễn ra gọn gàng, được hậu thuẫn bởi khối lượng lớn. Hiện tại, chúng tôi đang tìm kiếm một phiên đóng cửa theo ngày trên vùng $0.00001050 để xác nhận rằng đợt tăng hướng tới mục tiêu $0.00001250 là sắp đến. Như mọi khi với các tài sản có biến động cao, quản lý rủi ro chặt chẽ là điều thiết yếu.
Phân tích này chỉ nhằm mục đích cung cấp thông tin và không nên được xem là lời khuyên tài chính.
Dưới đây là infographic phân tích biểu đồ chuyên nghiệp dành cho bài đăng Binance Square của bạn:
CFTC&SECStrengthenOversightCollaborationOnPredictionMarkets.
#CLARITYActHearingSetforMay14
#USAdds115kJobs #JapanOnchainBondsand24/7Trading