

#zcashetfpostsfirstweeklyoutflow$93.6m
zcashetfpostsfirstweeklyoutflow$93.6m
Phổ biến
Mới nhất

·
--
Tăng giá
Xem bản dịch
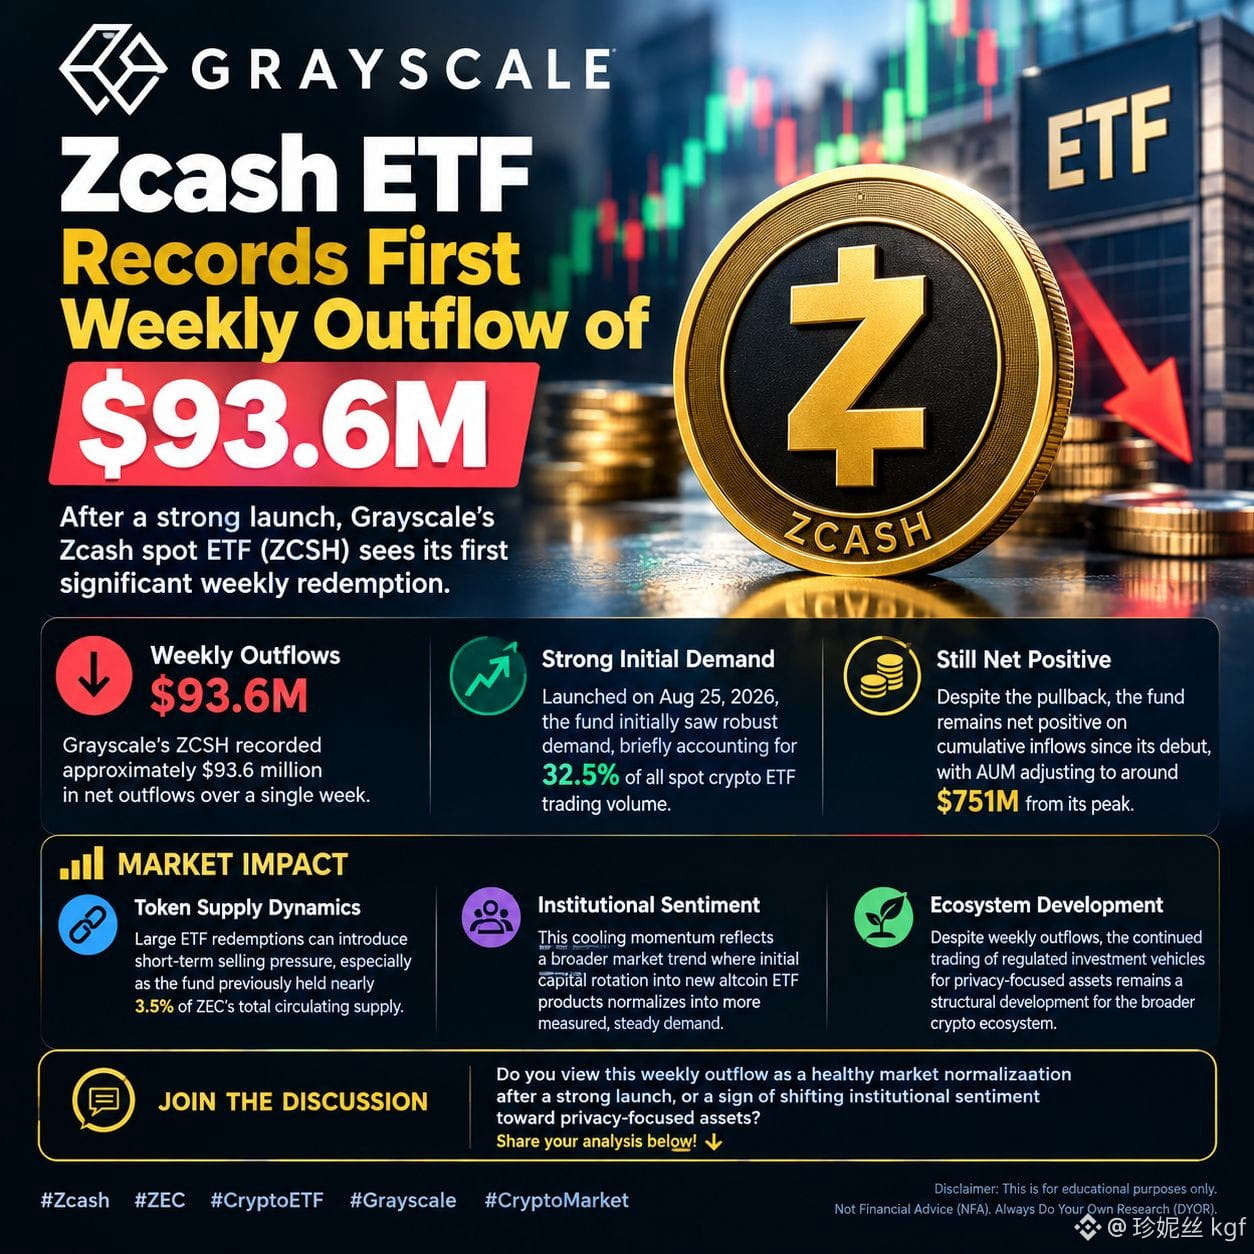
#ZcashETFPostsFirstWeeklyOutflow$93.6M 📊 Grayscale Zcash ETF Records First Weekly Outflow of $93.6m
The first U.S. spot Zcash ETF has reached a notable market milestone. After weeks of strong initial demand, the fund has recorded its first significant weekly redemption.
📰 Core News
• Grayscale’s Zcash spot ETF (Ticker: ZCSH) recorded approximately $93.6 million in net outflows over a single week [[37]].
• Launched on August 25, 2026, the fund initially saw robust demand, briefly accounting for 32.5% of all spot crypto ETF trading volume [[34]].
• Despite this recent pullback, the fund remains net positive on cumulative inflows since its debut, with assets under management (AUM) adjusting to around $751 million from its peak [[36]].
📈 Market Impact
• Token Supply Dynamics Large ETF redemptions can introduce short-term selling pressure, especially since the fund previously held nearly 3.5% of ZEC’s total circulating supply [[38]].
• Institutional Sentiment This cooling momentum reflects a broader market trend where initial capital rotation into new altcoin ETF products normalizes into more measured, steady demand.
• Ecosystem Development While weekly outflows draw attention, the continued trading of regulated investment vehicles for privacy-focused assets remains a structural development for the broader crypto ecosystem.
💬 Engagement
Do you view this weekly outflow as a healthy market normalization after a strong launch, or a sign of shifting institutional sentiment toward privacy-focused assets? Share your analysis below! 👇
#Zcash #ZEC #CryptoETF #Grayscale #CryptoMarket
This is for educational purposes only. Not Financial Advice (NFA). Always Do Your Own Research (DYOR).
$GLMR $QI $SAND
{future}(SANDUSDT)
{spot}(QIUSDT)
{spot}(GLMRUSDT)
#ZcashETFPostsFirstWeeklyOutflow$93.6M 📊 Grayscale Zcash ETF Records First Weekly Outflow of $93.6m
The first U.S. spot Zcash ETF has reached a notable market milestone. After weeks of strong initial demand, the fund has recorded its first significant weekly redemption.
📰 Core News
• Grayscale’s Zcash spot ETF (Ticker: ZCSH) recorded approximately $93.6 million in net outflows over a single week [[37]].
• Launched on August 25, 2026, the fund initially saw robust demand, briefly accounting for 32.5% of all spot crypto ETF trading volume [[34]].
• Despite this recent pullback, the fund remains net positive on cumulative inflows since its debut, with assets under management (AUM) adjusting to around $751 million from its peak [[36]].
📈 Market Impact
• Token Supply Dynamics Large ETF redemptions can introduce short-term selling pressure, especially since the fund previously held nearly 3.5% of ZEC’s total circulating supply [[38]].
• Institutional Sentiment This cooling momentum reflects a broader market trend where initial capital rotation into new altcoin ETF products normalizes into more measured, steady demand.
• Ecosystem Development While weekly outflows draw attention, the continued trading of regulated investment vehicles for privacy-focused assets remains a structural development for the broader crypto ecosystem.
💬 Engagement
Do you view this weekly outflow as a healthy market normalization after a strong launch, or a sign of shifting institutional sentiment toward privacy-focused assets? Share your analysis below! 👇
#Zcash #ZEC #CryptoETF #Grayscale #CryptoMarket
This is for educational purposes only. Not Financial Advice (NFA). Always Do Your Own Research (DYOR).
$GLMR $QI $SAND
The first U.S. spot Zcash ETF has reached a notable market milestone. After weeks of strong initial demand, the fund has recorded its first significant weekly redemption.
📰 Core News
• Grayscale’s Zcash spot ETF (Ticker: ZCSH) recorded approximately $93.6 million in net outflows over a single week [[37]].
• Launched on August 25, 2026, the fund initially saw robust demand, briefly accounting for 32.5% of all spot crypto ETF trading volume [[34]].
• Despite this recent pullback, the fund remains net positive on cumulative inflows since its debut, with assets under management (AUM) adjusting to around $751 million from its peak [[36]].
📈 Market Impact
• Token Supply Dynamics Large ETF redemptions can introduce short-term selling pressure, especially since the fund previously held nearly 3.5% of ZEC’s total circulating supply [[38]].
• Institutional Sentiment This cooling momentum reflects a broader market trend where initial capital rotation into new altcoin ETF products normalizes into more measured, steady demand.
• Ecosystem Development While weekly outflows draw attention, the continued trading of regulated investment vehicles for privacy-focused assets remains a structural development for the broader crypto ecosystem.
💬 Engagement
Do you view this weekly outflow as a healthy market normalization after a strong launch, or a sign of shifting institutional sentiment toward privacy-focused assets? Share your analysis below! 👇
#Zcash #ZEC #CryptoETF #Grayscale #CryptoMarket
This is for educational purposes only. Not Financial Advice (NFA). Always Do Your Own Research (DYOR).
$GLMR $QI $SAND
31

·
--
Tăng giá
Xem bản dịch
#ZcashETFPostsFirstWeeklyOutflow$93.6M
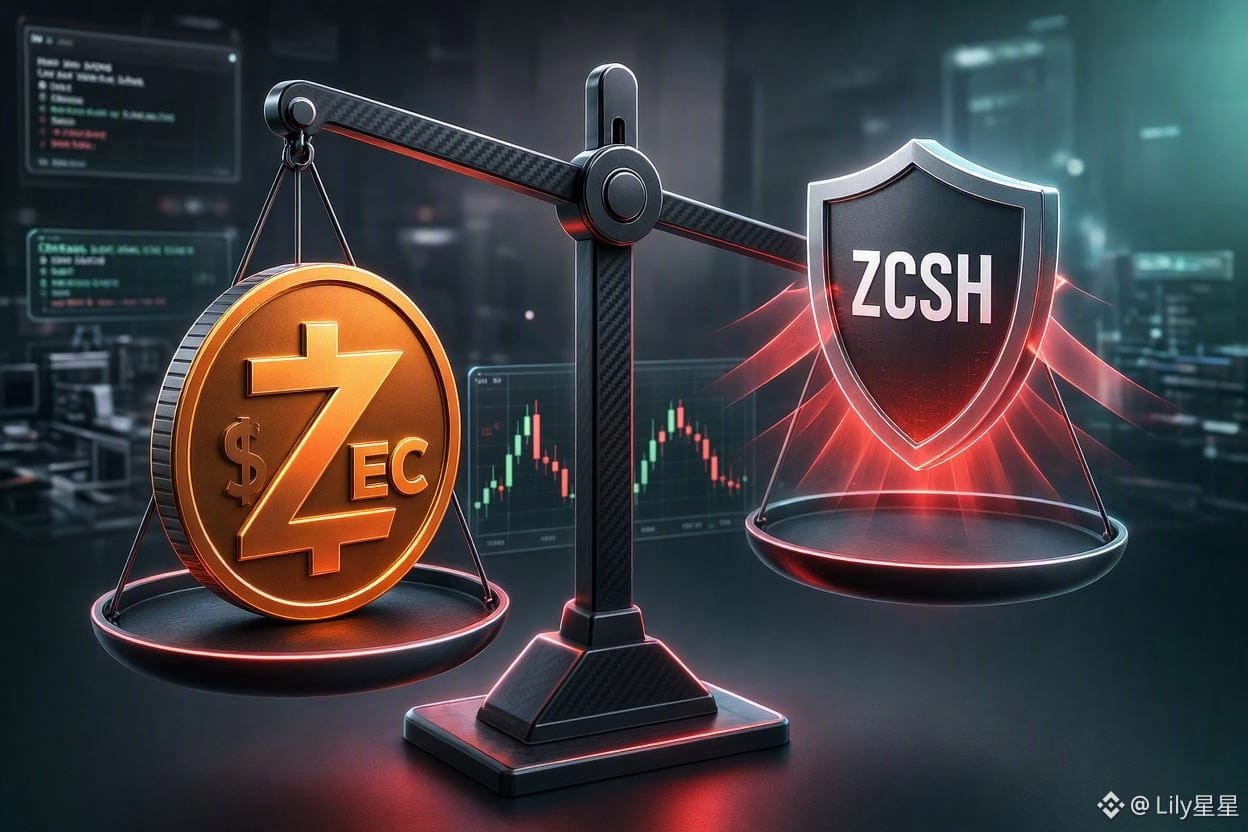
📉 "Zcash ETF Signals Shift: $93.6M Outflow Triggers First Weekly Net Withdrawal Since August Launch" 📊🔻
For the first time since launching in August, spot Zcash (ZEC) investment products have recorded a weekly net outflow. Institutional momentum appears to be taking a breath after weeks of sustained accumulation.
$ZEC
{future}(ZECUSDT)
According to data tracking fund movements, investors withdrew $93.6 million from Zcash products over the past week as price action cooled down across privacy-focused digital assets.
🔍 Key Takeaways from the Flow
Inflow Momentum Stalls: While Grayscale’s ZCSH attracted a massive $98.2 million two weeks prior, no fresh daily net inflows have been recorded since late September.
Single-Day Liquidation Peak: A notable portion of the pullback came on September 30, when U.S. spot ZEC ETFs logged $30.25 million in net daily outflows.
Price Pullback Correlation: ZEC traded around $1,308, reflecting a ~17.5% weekly drop and roughly 23% down from its recent local high near $1,690.
🎯 Key Technical & On-Chain Levels to Watch:
Immediate Support: $1,280 – $1,300
Major Resistance to Reclaim: $1,450 – $1,500
Institutional Threshold: Resumption of positive daily net inflows into ZCSH to confirm buyer confidence.
Despite short-term ETF redemptions, overall fund scale remains notable relative to early launch metrics. Traders are now watching closely to see if $1,300 acts as strong support before institutional buyers return.
👇 What’s your take on ZEC? Is this weekly outflow a healthy profit-taking dip before the next leg up, or are you waiting for lower entry levels? Share your play below! 💬👇
#GreekPoliceBustCryptoScamRingArrest17 #BitcoinRejectedAt$87K #zec
#ZcashETFPostsFirstWeeklyOutflow$93.6M
📉 "Zcash ETF Signals Shift: $93.6M Outflow Triggers First Weekly Net Withdrawal Since August Launch" 📊🔻
For the first time since launching in August, spot Zcash (ZEC) investment products have recorded a weekly net outflow. Institutional momentum appears to be taking a breath after weeks of sustained accumulation.
$ZEC
According to data tracking fund movements, investors withdrew $93.6 million from Zcash products over the past week as price action cooled down across privacy-focused digital assets.
🔍 Key Takeaways from the Flow
Inflow Momentum Stalls: While Grayscale’s ZCSH attracted a massive $98.2 million two weeks prior, no fresh daily net inflows have been recorded since late September.
Single-Day Liquidation Peak: A notable portion of the pullback came on September 30, when U.S. spot ZEC ETFs logged $30.25 million in net daily outflows.
Price Pullback Correlation: ZEC traded around $1,308, reflecting a ~17.5% weekly drop and roughly 23% down from its recent local high near $1,690.
🎯 Key Technical & On-Chain Levels to Watch:
Immediate Support: $1,280 – $1,300
Major Resistance to Reclaim: $1,450 – $1,500
Institutional Threshold: Resumption of positive daily net inflows into ZCSH to confirm buyer confidence.
Despite short-term ETF redemptions, overall fund scale remains notable relative to early launch metrics. Traders are now watching closely to see if $1,300 acts as strong support before institutional buyers return.
👇 What’s your take on ZEC? Is this weekly outflow a healthy profit-taking dip before the next leg up, or are you waiting for lower entry levels? Share your play below! 💬👇
#GreekPoliceBustCryptoScamRingArrest17 #BitcoinRejectedAt$87K #zec
📉 "Zcash ETF Signals Shift: $93.6M Outflow Triggers First Weekly Net Withdrawal Since August Launch" 📊🔻
For the first time since launching in August, spot Zcash (ZEC) investment products have recorded a weekly net outflow. Institutional momentum appears to be taking a breath after weeks of sustained accumulation.
$ZEC
According to data tracking fund movements, investors withdrew $93.6 million from Zcash products over the past week as price action cooled down across privacy-focused digital assets.
🔍 Key Takeaways from the Flow
Inflow Momentum Stalls: While Grayscale’s ZCSH attracted a massive $98.2 million two weeks prior, no fresh daily net inflows have been recorded since late September.
Single-Day Liquidation Peak: A notable portion of the pullback came on September 30, when U.S. spot ZEC ETFs logged $30.25 million in net daily outflows.
Price Pullback Correlation: ZEC traded around $1,308, reflecting a ~17.5% weekly drop and roughly 23% down from its recent local high near $1,690.
🎯 Key Technical & On-Chain Levels to Watch:
Immediate Support: $1,280 – $1,300
Major Resistance to Reclaim: $1,450 – $1,500
Institutional Threshold: Resumption of positive daily net inflows into ZCSH to confirm buyer confidence.
Despite short-term ETF redemptions, overall fund scale remains notable relative to early launch metrics. Traders are now watching closely to see if $1,300 acts as strong support before institutional buyers return.
👇 What’s your take on ZEC? Is this weekly outflow a healthy profit-taking dip before the next leg up, or are you waiting for lower entry levels? Share your play below! 💬👇
#GreekPoliceBustCryptoScamRingArrest17 #BitcoinRejectedAt$87K #zec
1
94

Bài viết
Xem bản dịch
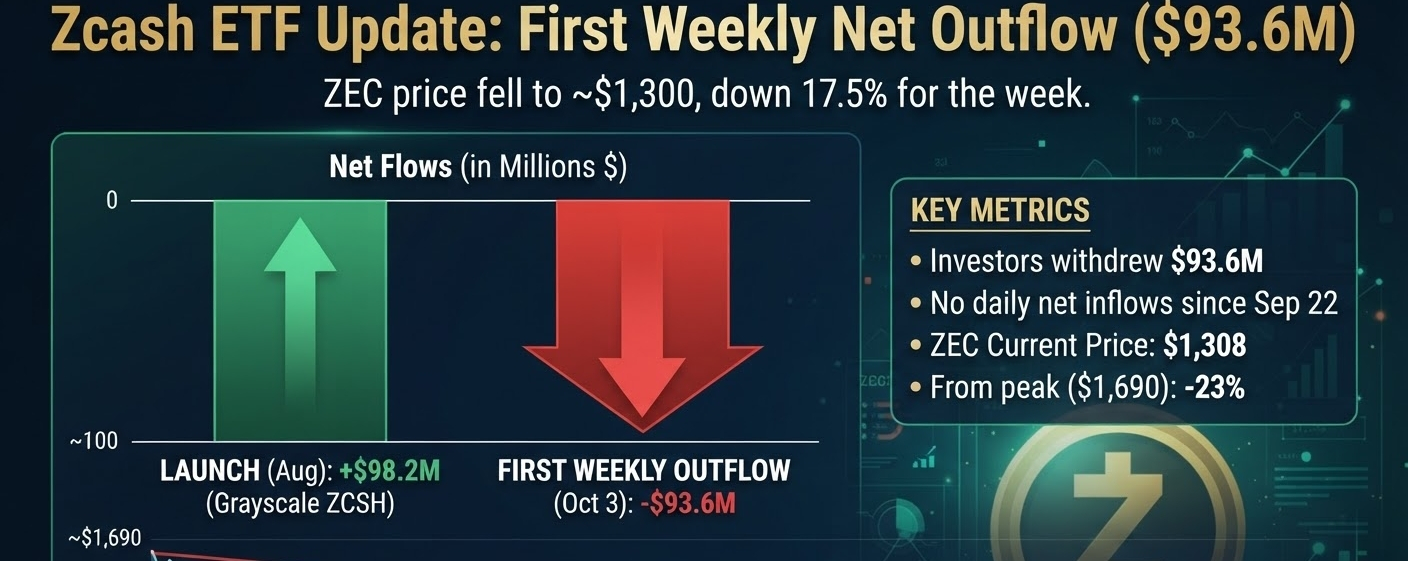
🚨 Zcash ETF Update: First Weekly Net Outflow ($93.6M) 📉#ZcashETFPostsFirstWeeklyOutflow$93.6M
🚀 Zcash ETF Update: First Weekly Net Outflow Recorded! 📉
Zcash ($ZEC) spot exchange-traded funds (ETFs) have experienced their first weekly net outflow since their official launch in August. 📊
According to market data from SoSoValue, investors pulled a total of $93.6 million as the price of ZEC retreated toward the $1,300 mark. 💸 This sharp shift follows a strong period where Grayscale’s ZCSH product alone attracted $98.2 million just two weeks prior. However, market momentum cooled significantly, with zero daily net inflows recorded since September 22. 🛑
As of October 3, ZEC was trading around $1,308, marking a decline of approximately 17.5% for the week and sitting about 23% lower than its recent peak of $1,690. 📉🔍
#zcash #ZEC #CryptoNews #ETF #MarketUpdate #BinanceSquare
$ZEC
🚨 Zcash ETF Update: First Weekly Net Outflow ($93.6M) 📉
#ZcashETFPostsFirstWeeklyOutflow$93.6M
🚀 Zcash ETF Update: First Weekly Net Outflow Recorded! 📉
Zcash ($ZEC ) spot exchange-traded funds (ETFs) have experienced their first weekly net outflow since their official launch in August. 📊
According to market data from SoSoValue, investors pulled a total of $93.6 million as the price of ZEC retreated toward the $1,300 mark. 💸 This sharp shift follows a strong period where Grayscale’s ZCSH product alone attracted $98.2 million just two weeks prior. However, market momentum cooled significantly, with zero daily net inflows recorded since September 22. 🛑
As of October 3, ZEC was trading around $1,308, marking a decline of approximately 17.5% for the week and sitting about 23% lower than its recent peak of $1,690. 📉🔍
#zcash #ZEC #CryptoNews #ETF #MarketUpdate #BinanceSquare
$ZEC
🚀 Zcash ETF Update: First Weekly Net Outflow Recorded! 📉
Zcash ($ZEC ) spot exchange-traded funds (ETFs) have experienced their first weekly net outflow since their official launch in August. 📊
According to market data from SoSoValue, investors pulled a total of $93.6 million as the price of ZEC retreated toward the $1,300 mark. 💸 This sharp shift follows a strong period where Grayscale’s ZCSH product alone attracted $98.2 million just two weeks prior. However, market momentum cooled significantly, with zero daily net inflows recorded since September 22. 🛑
As of October 3, ZEC was trading around $1,308, marking a decline of approximately 17.5% for the week and sitting about 23% lower than its recent peak of $1,690. 📉🔍
#zcash #ZEC #CryptoNews #ETF #MarketUpdate #BinanceSquare
$ZEC
25


·
--
CẬP NHẬT ETF ZCASH
ETF của Zcash đã ghi nhận dòng tiền ròng rút ra hằng tuần đầu tiên kể từ khi ra mắt vào tháng 8.
Các nhà đầu tư đã rút 93,6 triệu USD khi $ZEC giảm về gần 1.300 USD. Grayscale’s ZCSH đã thu hút 98,2 triệu USD hai tuần trước đó, nhưng không có ghi nhận dòng tiền ròng hằng ngày kể từ ngày 22/9, theo SoSoValue.
ZEC ở quanh mức 1.308 USD vào ngày 3/10, giảm khoảng 17,5% trong tuần và giảm xấp xỉ 23% so với đỉnh gần đây 1.690 USD.
$ZEC
{future}(ZECUSDT)
CẬP NHẬT ETF ZCASH
ETF của Zcash đã ghi nhận dòng tiền ròng rút ra hằng tuần đầu tiên kể từ khi ra mắt vào tháng 8.
Các nhà đầu tư đã rút 93,6 triệu USD khi $ZEC giảm về gần 1.300 USD. Grayscale’s ZCSH đã thu hút 98,2 triệu USD hai tuần trước đó, nhưng không có ghi nhận dòng tiền ròng hằng ngày kể từ ngày 22/9, theo SoSoValue.
ZEC ở quanh mức 1.308 USD vào ngày 3/10, giảm khoảng 17,5% trong tuần và giảm xấp xỉ 23% so với đỉnh gần đây 1.690 USD.
$ZEC
ETF của Zcash đã ghi nhận dòng tiền ròng rút ra hằng tuần đầu tiên kể từ khi ra mắt vào tháng 8.
Các nhà đầu tư đã rút 93,6 triệu USD khi $ZEC giảm về gần 1.300 USD. Grayscale’s ZCSH đã thu hút 98,2 triệu USD hai tuần trước đó, nhưng không có ghi nhận dòng tiền ròng hằng ngày kể từ ngày 22/9, theo SoSoValue.
ZEC ở quanh mức 1.308 USD vào ngày 3/10, giảm khoảng 17,5% trong tuần và giảm xấp xỉ 23% so với đỉnh gần đây 1.690 USD.
$ZEC
192

·
--
🚨 CẢNH SÁT HY LẠP VỪA TRIỆT PHÁ MỘT ĐƯỜNG DÂY LỪA ĐẢO CRYPTO — 17 NGƯỜI BỊ BẮT, BAO GỒM 9 NHÂN VIÊN QUÂN ĐỘI.
Chẳng phải một vụ “rug” nho nhỏ trên Telegram.
Giới chức Hy Lạp cho biết mạng lưới này đã hoạt động ít nhất từ năm 2025, dùng các lời hứa đầu tư crypto giả mạo và chiêu mộ theo kiểu kim tự tháp để lôi kéo nạn nhân mới. Cảnh sát ước tính hơn 8 triệu USD đã chảy vào đường dây này.
Chiêu trò được dựng theo đúng “kịch bản” của lòng tham:
“Nhân đôi tiền của bạn trong 50 ngày.”
Nạn nhân được khuyến khích lôi kéo thêm người tham gia để nhận lợi nhuận lớn hơn, trong khi các khoản rút tiền về sau bị đóng băng. Binance News cho biết có thể đã có khoảng 10.000 người tham gia, với mức đầu tư trung bình gần 800€.
Cảnh sát đã bắt 17 nghi phạm, trong khi hồ sơ vụ án cũng nêu tên thêm 9 người khác. Cơ quan chức năng đồng thời tịch thu hàng trăm nghìn euro tiền mặt và các bằng chứng khác.
Bài học thật sự là gì?
Crypto không tạo ra trò lừa đảo.
Trò lừa đảo chỉ dùng crypto như “lớp bọc”.
Khi lời mời chào là:
Lợi nhuận đảm bảo.
Tuyển thêm người.
Nhân đôi tiền nhanh chóng.
Đó không phải đầu tư.
Đó là “exit liquidity” đang lên tiếng. 👀
$BTC $ETH $BNB
#greekpolicebustcryptoscamringarrest17 #ZcashETFPostsFirstWeeklyOutflow$93.6M #BitcoinRejectedAt$87K #FedOctoberRateHikeOddsFallTo17% #NvidiaHitsRecordHighUp2.4%
🚨 CẢNH SÁT HY LẠP VỪA TRIỆT PHÁ MỘT ĐƯỜNG DÂY LỪA ĐẢO CRYPTO — 17 NGƯỜI BỊ BẮT, BAO GỒM 9 NHÂN VIÊN QUÂN ĐỘI.
Chẳng phải một vụ “rug” nho nhỏ trên Telegram.
Giới chức Hy Lạp cho biết mạng lưới này đã hoạt động ít nhất từ năm 2025, dùng các lời hứa đầu tư crypto giả mạo và chiêu mộ theo kiểu kim tự tháp để lôi kéo nạn nhân mới. Cảnh sát ước tính hơn 8 triệu USD đã chảy vào đường dây này.
Chiêu trò được dựng theo đúng “kịch bản” của lòng tham:
“Nhân đôi tiền của bạn trong 50 ngày.”
Nạn nhân được khuyến khích lôi kéo thêm người tham gia để nhận lợi nhuận lớn hơn, trong khi các khoản rút tiền về sau bị đóng băng. Binance News cho biết có thể đã có khoảng 10.000 người tham gia, với mức đầu tư trung bình gần 800€.
Cảnh sát đã bắt 17 nghi phạm, trong khi hồ sơ vụ án cũng nêu tên thêm 9 người khác. Cơ quan chức năng đồng thời tịch thu hàng trăm nghìn euro tiền mặt và các bằng chứng khác.
Bài học thật sự là gì?
Crypto không tạo ra trò lừa đảo.
Trò lừa đảo chỉ dùng crypto như “lớp bọc”.
Khi lời mời chào là:
Lợi nhuận đảm bảo.
Tuyển thêm người.
Nhân đôi tiền nhanh chóng.
Đó không phải đầu tư.
Đó là “exit liquidity” đang lên tiếng. 👀
$BTC $ETH $BNB
#greekpolicebustcryptoscamringarrest17 #ZcashETFPostsFirstWeeklyOutflow$93.6M #BitcoinRejectedAt$87K #FedOctoberRateHikeOddsFallTo17% #NvidiaHitsRecordHighUp2.4%
Chẳng phải một vụ “rug” nho nhỏ trên Telegram.
Giới chức Hy Lạp cho biết mạng lưới này đã hoạt động ít nhất từ năm 2025, dùng các lời hứa đầu tư crypto giả mạo và chiêu mộ theo kiểu kim tự tháp để lôi kéo nạn nhân mới. Cảnh sát ước tính hơn 8 triệu USD đã chảy vào đường dây này.
Chiêu trò được dựng theo đúng “kịch bản” của lòng tham:
“Nhân đôi tiền của bạn trong 50 ngày.”
Nạn nhân được khuyến khích lôi kéo thêm người tham gia để nhận lợi nhuận lớn hơn, trong khi các khoản rút tiền về sau bị đóng băng. Binance News cho biết có thể đã có khoảng 10.000 người tham gia, với mức đầu tư trung bình gần 800€.
Cảnh sát đã bắt 17 nghi phạm, trong khi hồ sơ vụ án cũng nêu tên thêm 9 người khác. Cơ quan chức năng đồng thời tịch thu hàng trăm nghìn euro tiền mặt và các bằng chứng khác.
Bài học thật sự là gì?
Crypto không tạo ra trò lừa đảo.
Trò lừa đảo chỉ dùng crypto như “lớp bọc”.
Khi lời mời chào là:
Lợi nhuận đảm bảo.
Tuyển thêm người.
Nhân đôi tiền nhanh chóng.
Đó không phải đầu tư.
Đó là “exit liquidity” đang lên tiếng. 👀
$BTC $ETH $BNB
#greekpolicebustcryptoscamringarrest17 #ZcashETFPostsFirstWeeklyOutflow$93.6M #BitcoinRejectedAt$87K #FedOctoberRateHikeOddsFallTo17% #NvidiaHitsRecordHighUp2.4%
997
·
--
Tăng giá
Xem bản dịch
#cerebrassinksnearly20%onreportnvidiatopoweropenai
🚀 🤖 "Cerebras Tumbles ~20%! Is Centralized AI Monopolizing—or Opening the Door for Web3 Compute?" 💥
A major shake-up is hitting the AI hardware space. Shares of Cerebras Systems ($CBRSB) reportedly dropped nearly 20%, falling to a post-IPO low around $166.43.
The selloff intensified after a report from research firm SemiAnalysis highlighted a crucial shift in OpenAI’s inference infrastructure, suggesting OpenAI selected Nvidia-powered systems over alternative hardware for its high-speed inference workloads.
🚨 Why Does This Matter for Crypto & Web3?
This development highlights a growing dilemma in traditional tech:
Centralized Infrastructure Bottlenecks: When a single chip maker (Nvidia) powers almost all top-tier AI inference workloads, centralized cloud providers face insane cost bottlenecks and single-point-of-failure risks.
📉 "Cerebras Sinks to $166 as OpenAI Favors Nvidia: What It Means for DeAI & $WLD" 📊
The Shift Toward Decentralized Compute: Centralized alternatives are finding it brutal to compete with Nvidia’s ecosystem dominance. This is precisely where decentralized compute protocols—like Render ($RENDER), Akash ($AKT), and Bittensor ($TAO)—aim to aggregate distributed GPU capacity globally.
🔑 Key Themes to Watch:
🏢 Centralized Hardware Concentration: High barrier to entry for centralized chipmakers.
⚡ Rising DeAI Demand: Growing need for permissionless, distributed compute networks.
🌐 Web3 AI Convergence: $WLD, $TAO, and$RENDER positioning as alternatives to corporate walled gardens.
The AI infrastructure battle is reaching a turning point. As traditional silicon startups struggle against tech monopolies, Web3's decentralized compute model could gain massive traction.
👇 What’s your take? Can decentralized crypto networks offer a real, scalable alternative to centralized AI monopolies? Let me know below! 💬👇
#GreekPoliceBustCryptoScamRingArrest17 #ZcashETFPostsFirstWeeklyOutflow$93.6M #AI $WLD $TAO$RENDER
#cerebrassinksnearly20%onreportnvidiatopoweropenai
🚀 🤖 "Cerebras Tumbles ~20%! Is Centralized AI Monopolizing—or Opening the Door for Web3 Compute?" 💥
A major shake-up is hitting the AI hardware space. Shares of Cerebras Systems ($CBRSB) reportedly dropped nearly 20%, falling to a post-IPO low around $166.43.
The selloff intensified after a report from research firm SemiAnalysis highlighted a crucial shift in OpenAI’s inference infrastructure, suggesting OpenAI selected Nvidia-powered systems over alternative hardware for its high-speed inference workloads.
🚨 Why Does This Matter for Crypto & Web3?
This development highlights a growing dilemma in traditional tech:
Centralized Infrastructure Bottlenecks: When a single chip maker (Nvidia) powers almost all top-tier AI inference workloads, centralized cloud providers face insane cost bottlenecks and single-point-of-failure risks.
📉 "Cerebras Sinks to $166 as OpenAI Favors Nvidia: What It Means for DeAI & $WLD" 📊
The Shift Toward Decentralized Compute: Centralized alternatives are finding it brutal to compete with Nvidia’s ecosystem dominance. This is precisely where decentralized compute protocols—like Render ($RENDER), Akash ($AKT), and Bittensor ($TAO)—aim to aggregate distributed GPU capacity globally.
🔑 Key Themes to Watch:
🏢 Centralized Hardware Concentration: High barrier to entry for centralized chipmakers.
⚡ Rising DeAI Demand: Growing need for permissionless, distributed compute networks.
🌐 Web3 AI Convergence: $WLD, $TAO, and$RENDER positioning as alternatives to corporate walled gardens.
The AI infrastructure battle is reaching a turning point. As traditional silicon startups struggle against tech monopolies, Web3's decentralized compute model could gain massive traction.
👇 What’s your take? Can decentralized crypto networks offer a real, scalable alternative to centralized AI monopolies? Let me know below! 💬👇
#GreekPoliceBustCryptoScamRingArrest17 #ZcashETFPostsFirstWeeklyOutflow$93.6M #AI $WLD $TAO$RENDER
🚀 🤖 "Cerebras Tumbles ~20%! Is Centralized AI Monopolizing—or Opening the Door for Web3 Compute?" 💥
A major shake-up is hitting the AI hardware space. Shares of Cerebras Systems ($CBRSB) reportedly dropped nearly 20%, falling to a post-IPO low around $166.43.
The selloff intensified after a report from research firm SemiAnalysis highlighted a crucial shift in OpenAI’s inference infrastructure, suggesting OpenAI selected Nvidia-powered systems over alternative hardware for its high-speed inference workloads.
🚨 Why Does This Matter for Crypto & Web3?
This development highlights a growing dilemma in traditional tech:
Centralized Infrastructure Bottlenecks: When a single chip maker (Nvidia) powers almost all top-tier AI inference workloads, centralized cloud providers face insane cost bottlenecks and single-point-of-failure risks.
📉 "Cerebras Sinks to $166 as OpenAI Favors Nvidia: What It Means for DeAI & $WLD" 📊
The Shift Toward Decentralized Compute: Centralized alternatives are finding it brutal to compete with Nvidia’s ecosystem dominance. This is precisely where decentralized compute protocols—like Render ($RENDER), Akash ($AKT), and Bittensor ($TAO)—aim to aggregate distributed GPU capacity globally.
🔑 Key Themes to Watch:
🏢 Centralized Hardware Concentration: High barrier to entry for centralized chipmakers.
⚡ Rising DeAI Demand: Growing need for permissionless, distributed compute networks.
🌐 Web3 AI Convergence: $WLD, $TAO, and$RENDER positioning as alternatives to corporate walled gardens.
The AI infrastructure battle is reaching a turning point. As traditional silicon startups struggle against tech monopolies, Web3's decentralized compute model could gain massive traction.
👇 What’s your take? Can decentralized crypto networks offer a real, scalable alternative to centralized AI monopolies? Let me know below! 💬👇
#GreekPoliceBustCryptoScamRingArrest17 #ZcashETFPostsFirstWeeklyOutflow$93.6M #AI $WLD $TAO$RENDER

1
1
·
--
Tăng giá
#usrussiaukrainetalksreportedlyincludelukoiloildeal
🌍 "Chuyển hướng địa chính trị: Đàm phán hòa bình Mỹ-Nga-Ukraine được cho là đã đụng tới thỏa thuận năng lượng của Lukoil" 🛢️📉
$ZEC
{future}(ZECUSDT)
Những tin tức địa chính trị lớn đang liên tục xuất hiện trên các kênh tin tài chính trong hôm nay. Các cuộc thảo luận ngoại giao cấp cao giữa đại diện Mỹ và quan chức Nga nhằm giải quyết xung đột tại Ukraine được cho là đã mở rộng sang khả năng một thỏa thuận trị giá nhiều tỷ USD liên quan đến tài sản năng lượng quốc tế của Lukoil.
Các báo cáo cho biết khả năng tái cấu trúc tài sản hoặc xây dựng các khuôn khổ năng lượng hậu chiến chung có thể là một phần trong nỗ lực bình thường hóa kinh tế rộng hơn, nếu những bước đột phá ngoại giao trở thành hiện thực.
🧠 Điều này có ý nghĩa gì đối với thị trường toàn cầu & Crypto?
Giá dầu thô & Kỳ vọng lạm phát: Việc giảm bớt xung đột năng lượng tiềm năng và rủi ro đối với lệnh trừng phạt có thể làm hạ nhiệt giá dầu thô toàn cầu. Giá năng lượng giảm tự nhiên sẽ giảm áp lực lạm phát trên tiêu đề, từ đó giúp các ngân hàng trung ương trên khắp thế giới có thêm dư địa để giảm lãi suất.
Dòng tiền thanh khoản toàn cầu: Bất kỳ con đường đáng tin cậy nào hướng tới việc hạ nhiệt căng thẳng địa chính trị cũng thường làm giảm mức bù rủi ro “thiên nga đen” trên toàn bộ thị trường vốn toàn cầu.
Tâm lý Risk-On cho Crypto: Khi các rủi ro vĩ mô mang tính hệ thống lắng dịu và lạm phát do năng lượng nguội đi, dòng vốn theo lịch sử sẽ rời khỏi các tài sản trú ẩn an toàn (tiền mặt, trái phiếu ngắn hạn) và quay trở lại các nhóm ngành tăng trưởng cao theo hướng risk-on như $BTC, $ETH và các altcoin lớn.
$NVDA.US
{stock_us}(NVDA.US)
📊 Các yếu tố vĩ mô chính cần theo dõi:
Thị trường năng lượng: Biến động giá dầu thô và việc tái hiệu chỉnh chuỗi cung ứng.
Lạm phát vĩ mô: Xu hướng Chỉ số Giá Tiêu dùng (CPI) chịu ảnh hưởng bởi chi phí năng lượng.
Dòng vốn: Dịch chuyển từ các vị thế phòng thủ sang tài sản số và cổ phiếu toàn cầu.
👇 Bạn nghĩ gì về tin tức này? Bạn có thấy việc hạ nhiệt địa chính trị sẽ khởi động một đợt tăng giá lớn hơn trên các tài sản rủi ro, hay bạn vẫn thận trọng? Hãy chia sẻ quan điểm của bạn bên dưới! 💬👇
#GreekPoliceBustCryptoScamRingArrest17 #ZcashETFPostsFirstWeeklyOutflow$93.6M
#usrussiaukrainetalksreportedlyincludelukoiloildeal
🌍 "Chuyển hướng địa chính trị: Đàm phán hòa bình Mỹ-Nga-Ukraine được cho là đã đụng tới thỏa thuận năng lượng của Lukoil" 🛢️📉
$ZEC
Những tin tức địa chính trị lớn đang liên tục xuất hiện trên các kênh tin tài chính trong hôm nay. Các cuộc thảo luận ngoại giao cấp cao giữa đại diện Mỹ và quan chức Nga nhằm giải quyết xung đột tại Ukraine được cho là đã mở rộng sang khả năng một thỏa thuận trị giá nhiều tỷ USD liên quan đến tài sản năng lượng quốc tế của Lukoil.
Các báo cáo cho biết khả năng tái cấu trúc tài sản hoặc xây dựng các khuôn khổ năng lượng hậu chiến chung có thể là một phần trong nỗ lực bình thường hóa kinh tế rộng hơn, nếu những bước đột phá ngoại giao trở thành hiện thực.
🧠 Điều này có ý nghĩa gì đối với thị trường toàn cầu & Crypto?
Giá dầu thô & Kỳ vọng lạm phát: Việc giảm bớt xung đột năng lượng tiềm năng và rủi ro đối với lệnh trừng phạt có thể làm hạ nhiệt giá dầu thô toàn cầu. Giá năng lượng giảm tự nhiên sẽ giảm áp lực lạm phát trên tiêu đề, từ đó giúp các ngân hàng trung ương trên khắp thế giới có thêm dư địa để giảm lãi suất.
Dòng tiền thanh khoản toàn cầu: Bất kỳ con đường đáng tin cậy nào hướng tới việc hạ nhiệt căng thẳng địa chính trị cũng thường làm giảm mức bù rủi ro “thiên nga đen” trên toàn bộ thị trường vốn toàn cầu.
Tâm lý Risk-On cho Crypto: Khi các rủi ro vĩ mô mang tính hệ thống lắng dịu và lạm phát do năng lượng nguội đi, dòng vốn theo lịch sử sẽ rời khỏi các tài sản trú ẩn an toàn (tiền mặt, trái phiếu ngắn hạn) và quay trở lại các nhóm ngành tăng trưởng cao theo hướng risk-on như $BTC, $ETH và các altcoin lớn.
$NVDA.US
📊 Các yếu tố vĩ mô chính cần theo dõi:
Thị trường năng lượng: Biến động giá dầu thô và việc tái hiệu chỉnh chuỗi cung ứng.
Lạm phát vĩ mô: Xu hướng Chỉ số Giá Tiêu dùng (CPI) chịu ảnh hưởng bởi chi phí năng lượng.
Dòng vốn: Dịch chuyển từ các vị thế phòng thủ sang tài sản số và cổ phiếu toàn cầu.
👇 Bạn nghĩ gì về tin tức này? Bạn có thấy việc hạ nhiệt địa chính trị sẽ khởi động một đợt tăng giá lớn hơn trên các tài sản rủi ro, hay bạn vẫn thận trọng? Hãy chia sẻ quan điểm của bạn bên dưới! 💬👇
#GreekPoliceBustCryptoScamRingArrest17 #ZcashETFPostsFirstWeeklyOutflow$93.6M
🌍 "Chuyển hướng địa chính trị: Đàm phán hòa bình Mỹ-Nga-Ukraine được cho là đã đụng tới thỏa thuận năng lượng của Lukoil" 🛢️📉
$ZEC
Những tin tức địa chính trị lớn đang liên tục xuất hiện trên các kênh tin tài chính trong hôm nay. Các cuộc thảo luận ngoại giao cấp cao giữa đại diện Mỹ và quan chức Nga nhằm giải quyết xung đột tại Ukraine được cho là đã mở rộng sang khả năng một thỏa thuận trị giá nhiều tỷ USD liên quan đến tài sản năng lượng quốc tế của Lukoil.
Các báo cáo cho biết khả năng tái cấu trúc tài sản hoặc xây dựng các khuôn khổ năng lượng hậu chiến chung có thể là một phần trong nỗ lực bình thường hóa kinh tế rộng hơn, nếu những bước đột phá ngoại giao trở thành hiện thực.
🧠 Điều này có ý nghĩa gì đối với thị trường toàn cầu & Crypto?
Giá dầu thô & Kỳ vọng lạm phát: Việc giảm bớt xung đột năng lượng tiềm năng và rủi ro đối với lệnh trừng phạt có thể làm hạ nhiệt giá dầu thô toàn cầu. Giá năng lượng giảm tự nhiên sẽ giảm áp lực lạm phát trên tiêu đề, từ đó giúp các ngân hàng trung ương trên khắp thế giới có thêm dư địa để giảm lãi suất.
Dòng tiền thanh khoản toàn cầu: Bất kỳ con đường đáng tin cậy nào hướng tới việc hạ nhiệt căng thẳng địa chính trị cũng thường làm giảm mức bù rủi ro “thiên nga đen” trên toàn bộ thị trường vốn toàn cầu.
Tâm lý Risk-On cho Crypto: Khi các rủi ro vĩ mô mang tính hệ thống lắng dịu và lạm phát do năng lượng nguội đi, dòng vốn theo lịch sử sẽ rời khỏi các tài sản trú ẩn an toàn (tiền mặt, trái phiếu ngắn hạn) và quay trở lại các nhóm ngành tăng trưởng cao theo hướng risk-on như $BTC, $ETH và các altcoin lớn.
$NVDA.US
📊 Các yếu tố vĩ mô chính cần theo dõi:
Thị trường năng lượng: Biến động giá dầu thô và việc tái hiệu chỉnh chuỗi cung ứng.
Lạm phát vĩ mô: Xu hướng Chỉ số Giá Tiêu dùng (CPI) chịu ảnh hưởng bởi chi phí năng lượng.
Dòng vốn: Dịch chuyển từ các vị thế phòng thủ sang tài sản số và cổ phiếu toàn cầu.
👇 Bạn nghĩ gì về tin tức này? Bạn có thấy việc hạ nhiệt địa chính trị sẽ khởi động một đợt tăng giá lớn hơn trên các tài sản rủi ro, hay bạn vẫn thận trọng? Hãy chia sẻ quan điểm của bạn bên dưới! 💬👇
#GreekPoliceBustCryptoScamRingArrest17 #ZcashETFPostsFirstWeeklyOutflow$93.6M

1
202

·
--
#fedoctoberratehikeoddsfallto17%
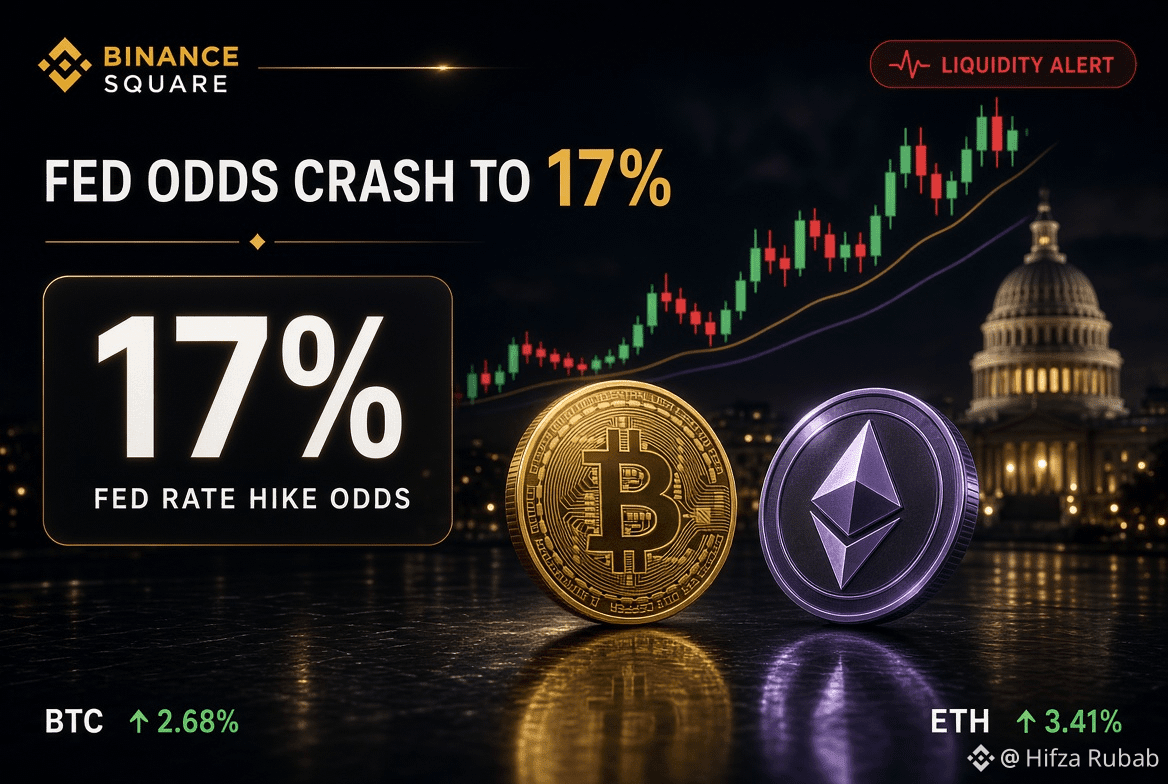
🚨 CẢNH BÁO THANH KHOẢN: XÁC SUẤT TĂNG LÃI SUẤT FED GIẢM XUỐNG CÒN 17%! 📊⚡
Báo cáo việc làm Mỹ yếu kém đã đẩy xác suất Fed tăng lãi suất trong tháng 10 từ 75% xuống còn 17%!
Kỳ vọng chính sách nới lỏng làm giảm lợi suất và mở khóa thanh khoản thị trường, tạo lực đẩy vĩ mô mạnh mẽ cho các tài sản rủi ro của crypto! 🚀🔥
💡 BÀI HỌC DÀNH CHO TRADER:
Ít lần tăng lãi suất hơn = thanh khoản toàn cầu mở rộng → dòng tiền vào crypto mạnh mẽ! Tuy nhiên, thị trường lao động hạ nhiệt đồng nghĩa cần theo dõi dữ liệu kinh tế sát sao trước khi sử dụng đòn bẩy nặng tay! 📈⚠️
🔍 2 “MACRO COIN” CẦN THEO DÕI:
🌐 $BTC (Bitcoin) — “Máy hút” thanh khoản hàng đầu, dẫn dắt cuộc tấn công của thị trường khi các lực cản vĩ mô suy yếu! 💎⚡
🔹 $ETH (Ethereum) — Tài sản smart-contract hàng đầu, sẵn sàng cho sự luân chuyển vốn lớn khi khẩu vị rủi ro mở rộng! 🚀📊
Sự dịch chuyển thanh khoản này có đưa Bitcoin lên mức cao mới không? Hãy thả mục tiêu của bạn bên dưới! 👇✨
#FedOctoberRateHikeOddsFallTo17%
#BitcoinRejectedAt$87K
#ZcashETFPostsFirstWeeklyOutflow$93.6M
#GreekPoliceBustCryptoScamRingArrest17
{spot}(ETHUSDT)
{spot}(BTCUSDT)
#fedoctoberratehikeoddsfallto17%
🚨 CẢNH BÁO THANH KHOẢN: XÁC SUẤT TĂNG LÃI SUẤT FED GIẢM XUỐNG CÒN 17%! 📊⚡
Báo cáo việc làm Mỹ yếu kém đã đẩy xác suất Fed tăng lãi suất trong tháng 10 từ 75% xuống còn 17%!
Kỳ vọng chính sách nới lỏng làm giảm lợi suất và mở khóa thanh khoản thị trường, tạo lực đẩy vĩ mô mạnh mẽ cho các tài sản rủi ro của crypto! 🚀🔥
💡 BÀI HỌC DÀNH CHO TRADER:
Ít lần tăng lãi suất hơn = thanh khoản toàn cầu mở rộng → dòng tiền vào crypto mạnh mẽ! Tuy nhiên, thị trường lao động hạ nhiệt đồng nghĩa cần theo dõi dữ liệu kinh tế sát sao trước khi sử dụng đòn bẩy nặng tay! 📈⚠️
🔍 2 “MACRO COIN” CẦN THEO DÕI:
🌐 $BTC (Bitcoin) — “Máy hút” thanh khoản hàng đầu, dẫn dắt cuộc tấn công của thị trường khi các lực cản vĩ mô suy yếu! 💎⚡
🔹 $ETH (Ethereum) — Tài sản smart-contract hàng đầu, sẵn sàng cho sự luân chuyển vốn lớn khi khẩu vị rủi ro mở rộng! 🚀📊
Sự dịch chuyển thanh khoản này có đưa Bitcoin lên mức cao mới không? Hãy thả mục tiêu của bạn bên dưới! 👇✨
#FedOctoberRateHikeOddsFallTo17%
#BitcoinRejectedAt$87K
#ZcashETFPostsFirstWeeklyOutflow$93.6M
#GreekPoliceBustCryptoScamRingArrest17
🚨 CẢNH BÁO THANH KHOẢN: XÁC SUẤT TĂNG LÃI SUẤT FED GIẢM XUỐNG CÒN 17%! 📊⚡
Báo cáo việc làm Mỹ yếu kém đã đẩy xác suất Fed tăng lãi suất trong tháng 10 từ 75% xuống còn 17%!
Kỳ vọng chính sách nới lỏng làm giảm lợi suất và mở khóa thanh khoản thị trường, tạo lực đẩy vĩ mô mạnh mẽ cho các tài sản rủi ro của crypto! 🚀🔥
💡 BÀI HỌC DÀNH CHO TRADER:
Ít lần tăng lãi suất hơn = thanh khoản toàn cầu mở rộng → dòng tiền vào crypto mạnh mẽ! Tuy nhiên, thị trường lao động hạ nhiệt đồng nghĩa cần theo dõi dữ liệu kinh tế sát sao trước khi sử dụng đòn bẩy nặng tay! 📈⚠️
🔍 2 “MACRO COIN” CẦN THEO DÕI:
🌐 $BTC (Bitcoin) — “Máy hút” thanh khoản hàng đầu, dẫn dắt cuộc tấn công của thị trường khi các lực cản vĩ mô suy yếu! 💎⚡
🔹 $ETH (Ethereum) — Tài sản smart-contract hàng đầu, sẵn sàng cho sự luân chuyển vốn lớn khi khẩu vị rủi ro mở rộng! 🚀📊
Sự dịch chuyển thanh khoản này có đưa Bitcoin lên mức cao mới không? Hãy thả mục tiêu của bạn bên dưới! 👇✨
#FedOctoberRateHikeOddsFallTo17%
#BitcoinRejectedAt$87K
#ZcashETFPostsFirstWeeklyOutflow$93.6M
#GreekPoliceBustCryptoScamRingArrest17
1
193

·
--
Bài viết
Xem bản dịch
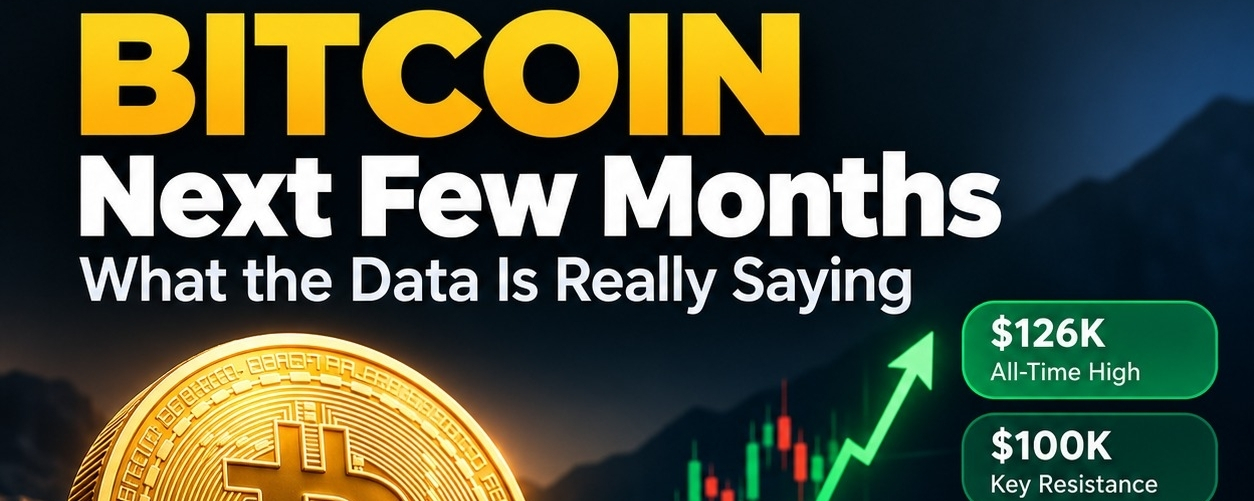
Bitcoin Next Few Months: What the Data Is Really SayingBitcoin is currently trading around $84.5K, roughly 33% below its $126K all time high.
So the big question is:
Is BTC preparing for another major rally, or is this just a temporary recovery before another drop?
I looked at the latest ETF flows, on chain data, market structure and macro conditions. The picture is more interesting than it looks.
1. Institutional Money Is Coming Back
One of the strongest signals right now is Bitcoin ETF demand.
U.S. spot Bitcoin ETFs recorded approximately $2.65 billion in net inflows during September, while Q3 inflows were around $6.34 billion.
That matters.
Bitcoin's price is still far below its all time high, but institutional investors are continuing to gain exposure.
This creates a potential supply demand imbalance.
Less BTC available for sale combined with increasing institutional demand could potentially push prices higher.
But ETF flows need to remain positive. If they suddenly reverse into sustained outflows, the bullish thesis becomes much weaker.
2. Bitcoin Supply Is Getting Tighter
On chain data shows approximately 63% of Bitcoin's supply has not moved for at least one year.
That's a huge number.
A large percentage of BTC is effectively sitting with long term holders rather than constantly circulating through the market.
This becomes particularly important if demand increases.
Bitcoin doesn't need everyone to buy.
It only needs new demand to compete for a relatively limited amount of actively traded supply.
3. Bitcoin Isn't Yet in Extreme On Chain Euphoria
Bitcoin's MVRV is currently around 1.58, while realized price is approximately $53K.
BTC is therefore trading substantially above the average on chain cost basis, but the valuation is still nowhere near the extreme levels historically associated with maximum market euphoria.
That suggests something important.
The market has recovered, but the on chain data isn't screaming "cycle top" yet.
Of course, this doesn't mean Bitcoin can't fall.
It simply means there is still room for the market to move in either direction.
4. The Biggest Risk Is Macro
Bitcoin's biggest enemy over the next few months may not be Bitcoin itself.
It may be global liquidity.
U.S. interest rates remain relatively high, meaning financial conditions aren't yet extremely supportive of risk assets.
If markets begin expecting easier monetary policy, falling yields and increasing liquidity, Bitcoin could benefit significantly.
But if inflation remains sticky and rates stay higher for longer, BTC could struggle.
5. The Levels I'm Watching
For me, Bitcoin's next major battle is between $80K and $100K.
Below $80K
The current recovery structure becomes much weaker.
$87K to $90K
This is the first major resistance zone.
A convincing breakout could trigger additional momentum.
Above $100k
The psychological and technical picture changes dramatically.
At that point, the previous $126K all time high would become a major level to watch again.
6. Three Possible Scenarios
Bullish Scenario: $95K to $115K+
If ETF inflows remain strong, BTC breaks $90K and liquidity improves, Bitcoin could move toward $100K and potentially beyond.
Neutral Scenario: $78K to $95K
Bitcoin could spend months consolidating while institutional demand slowly absorbs supply.
This would create a longer period of accumulation and price discovery.
Bearish Scenario: $60K to $78K
A sustained break below $80K combined with ETF outflows and worsening macro conditions could send BTC significantly lower.
Final Take
I don't think the smartest question is:
"Will Bitcoin hit $100K?"
The better question is:
"Is demand increasing faster than available supply?"
Right now, several pieces of the puzzle are pointing in that direction:
Strong ETF demand
Approximately 63% dormant supply
BTC above realized price
No extreme MVRV reading
But macro liquidity remains the biggest wildcard.
So over the next few months, I'm watching three things above everything else:
ETF FLOWS
$80K TO $90K PRICE STRUCTURE
GLOBAL LIQUIDITY
If all three turn bullish at the same time, Bitcoin could move very quickly.
If they turn bearish, $80K could become the level the bulls desperately need to defend.
The next few months could be extremely important for Bitcoin.
This is market analysis, not financial advice. Crypto is highly volatile.
$BTC
#ZcashETFPostsFirstWeeklyOutflow$93.6M #NvidiaHitsRecordHighUp2.4%
Bitcoin Next Few Months: What the Data Is Really Saying
Bitcoin is currently trading around $84.5K, roughly 33% below its $126K all time high.
So the big question is:
Is BTC preparing for another major rally, or is this just a temporary recovery before another drop?
I looked at the latest ETF flows, on chain data, market structure and macro conditions. The picture is more interesting than it looks.
1. Institutional Money Is Coming Back
One of the strongest signals right now is Bitcoin ETF demand.
U.S. spot Bitcoin ETFs recorded approximately $2.65 billion in net inflows during September, while Q3 inflows were around $6.34 billion.
That matters.
Bitcoin's price is still far below its all time high, but institutional investors are continuing to gain exposure.
This creates a potential supply demand imbalance.
Less BTC available for sale combined with increasing institutional demand could potentially push prices higher.
But ETF flows need to remain positive. If they suddenly reverse into sustained outflows, the bullish thesis becomes much weaker.
2. Bitcoin Supply Is Getting Tighter
On chain data shows approximately 63% of Bitcoin's supply has not moved for at least one year.
That's a huge number.
A large percentage of BTC is effectively sitting with long term holders rather than constantly circulating through the market.
This becomes particularly important if demand increases.
Bitcoin doesn't need everyone to buy.
It only needs new demand to compete for a relatively limited amount of actively traded supply.
3. Bitcoin Isn't Yet in Extreme On Chain Euphoria
Bitcoin's MVRV is currently around 1.58, while realized price is approximately $53K.
BTC is therefore trading substantially above the average on chain cost basis, but the valuation is still nowhere near the extreme levels historically associated with maximum market euphoria.
That suggests something important.
The market has recovered, but the on chain data isn't screaming "cycle top" yet.
Of course, this doesn't mean Bitcoin can't fall.
It simply means there is still room for the market to move in either direction.
4. The Biggest Risk Is Macro
Bitcoin's biggest enemy over the next few months may not be Bitcoin itself.
It may be global liquidity.
U.S. interest rates remain relatively high, meaning financial conditions aren't yet extremely supportive of risk assets.
If markets begin expecting easier monetary policy, falling yields and increasing liquidity, Bitcoin could benefit significantly.
But if inflation remains sticky and rates stay higher for longer, BTC could struggle.
5. The Levels I'm Watching
For me, Bitcoin's next major battle is between $80K and $100K.
Below $80K
The current recovery structure becomes much weaker.
$87K to $90K
This is the first major resistance zone.
A convincing breakout could trigger additional momentum.
Above $100k
The psychological and technical picture changes dramatically.
At that point, the previous $126K all time high would become a major level to watch again.
6. Three Possible Scenarios
Bullish Scenario: $95K to $115K+
If ETF inflows remain strong, BTC breaks $90K and liquidity improves, Bitcoin could move toward $100K and potentially beyond.
Neutral Scenario: $78K to $95K
Bitcoin could spend months consolidating while institutional demand slowly absorbs supply.
This would create a longer period of accumulation and price discovery.
Bearish Scenario: $60K to $78K
A sustained break below $80K combined with ETF outflows and worsening macro conditions could send BTC significantly lower.
Final Take
I don't think the smartest question is:
"Will Bitcoin hit $100K?"
The better question is:
"Is demand increasing faster than available supply?"
Right now, several pieces of the puzzle are pointing in that direction:
Strong ETF demand
Approximately 63% dormant supply
BTC above realized price
No extreme MVRV reading
But macro liquidity remains the biggest wildcard.
So over the next few months, I'm watching three things above everything else:
ETF FLOWS
$80K TO $90K PRICE STRUCTURE
GLOBAL LIQUIDITY
If all three turn bullish at the same time, Bitcoin could move very quickly.
If they turn bearish, $80K could become the level the bulls desperately need to defend.
The next few months could be extremely important for Bitcoin.
This is market analysis, not financial advice. Crypto is highly volatile.
$BTC
#ZcashETFPostsFirstWeeklyOutflow$93.6M #NvidiaHitsRecordHighUp2.4%
So the big question is:
Is BTC preparing for another major rally, or is this just a temporary recovery before another drop?
I looked at the latest ETF flows, on chain data, market structure and macro conditions. The picture is more interesting than it looks.
1. Institutional Money Is Coming Back
One of the strongest signals right now is Bitcoin ETF demand.
U.S. spot Bitcoin ETFs recorded approximately $2.65 billion in net inflows during September, while Q3 inflows were around $6.34 billion.
That matters.
Bitcoin's price is still far below its all time high, but institutional investors are continuing to gain exposure.
This creates a potential supply demand imbalance.
Less BTC available for sale combined with increasing institutional demand could potentially push prices higher.
But ETF flows need to remain positive. If they suddenly reverse into sustained outflows, the bullish thesis becomes much weaker.
2. Bitcoin Supply Is Getting Tighter
On chain data shows approximately 63% of Bitcoin's supply has not moved for at least one year.
That's a huge number.
A large percentage of BTC is effectively sitting with long term holders rather than constantly circulating through the market.
This becomes particularly important if demand increases.
Bitcoin doesn't need everyone to buy.
It only needs new demand to compete for a relatively limited amount of actively traded supply.
3. Bitcoin Isn't Yet in Extreme On Chain Euphoria
Bitcoin's MVRV is currently around 1.58, while realized price is approximately $53K.
BTC is therefore trading substantially above the average on chain cost basis, but the valuation is still nowhere near the extreme levels historically associated with maximum market euphoria.
That suggests something important.
The market has recovered, but the on chain data isn't screaming "cycle top" yet.
Of course, this doesn't mean Bitcoin can't fall.
It simply means there is still room for the market to move in either direction.
4. The Biggest Risk Is Macro
Bitcoin's biggest enemy over the next few months may not be Bitcoin itself.
It may be global liquidity.
U.S. interest rates remain relatively high, meaning financial conditions aren't yet extremely supportive of risk assets.
If markets begin expecting easier monetary policy, falling yields and increasing liquidity, Bitcoin could benefit significantly.
But if inflation remains sticky and rates stay higher for longer, BTC could struggle.
5. The Levels I'm Watching
For me, Bitcoin's next major battle is between $80K and $100K.
Below $80K
The current recovery structure becomes much weaker.
$87K to $90K
This is the first major resistance zone.
A convincing breakout could trigger additional momentum.
Above $100k
The psychological and technical picture changes dramatically.
At that point, the previous $126K all time high would become a major level to watch again.
6. Three Possible Scenarios
Bullish Scenario: $95K to $115K+
If ETF inflows remain strong, BTC breaks $90K and liquidity improves, Bitcoin could move toward $100K and potentially beyond.
Neutral Scenario: $78K to $95K
Bitcoin could spend months consolidating while institutional demand slowly absorbs supply.
This would create a longer period of accumulation and price discovery.
Bearish Scenario: $60K to $78K
A sustained break below $80K combined with ETF outflows and worsening macro conditions could send BTC significantly lower.
Final Take
I don't think the smartest question is:
"Will Bitcoin hit $100K?"
The better question is:
"Is demand increasing faster than available supply?"
Right now, several pieces of the puzzle are pointing in that direction:
Strong ETF demand
Approximately 63% dormant supply
BTC above realized price
No extreme MVRV reading
But macro liquidity remains the biggest wildcard.
So over the next few months, I'm watching three things above everything else:
ETF FLOWS
$80K TO $90K PRICE STRUCTURE
GLOBAL LIQUIDITY
If all three turn bullish at the same time, Bitcoin could move very quickly.
If they turn bearish, $80K could become the level the bulls desperately need to defend.
The next few months could be extremely important for Bitcoin.
This is market analysis, not financial advice. Crypto is highly volatile.
$BTC
#ZcashETFPostsFirstWeeklyOutflow$93.6M #NvidiaHitsRecordHighUp2.4%
6

Xem bản dịch
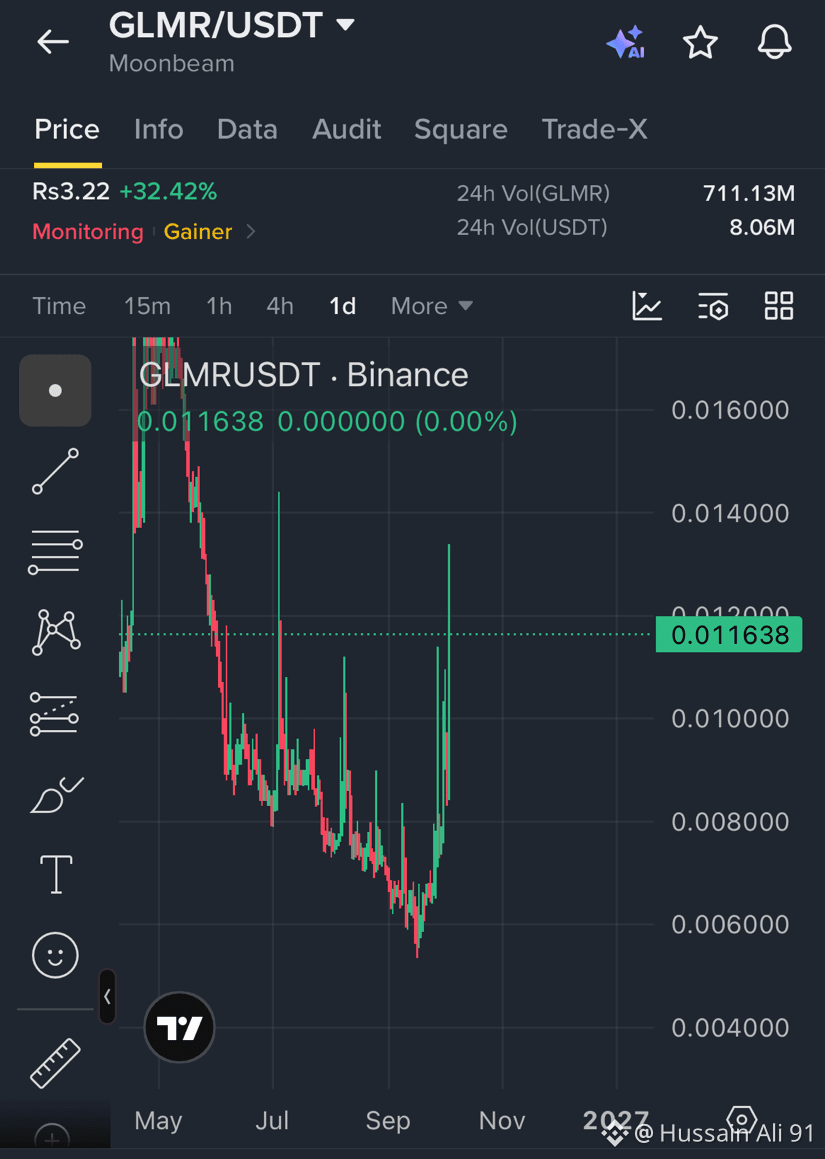
🚀 Why Is GLMR Pumping?
$GLMR is making a strong move after a major increase in trading activity and buying momentum. The recent Base migration and AI-agent narrative around Moonbeam may also be attracting renewed attention.
The biggest signal right now is volume. With GLMR still having a relatively small market cap, increased buying pressure can create very sharp moves.
But this is a highly volatile token, so traders should watch whether the volume stays strong or the pump quickly fades #GLMR/USDT #ZcashETFPostsFirstWeeklyOutflow$93.6M #GreekPoliceBustCryptoScamRingArrest17
{spot}(GLMRUSDT)
🚀 Why Is GLMR Pumping?
$GLMR is making a strong move after a major increase in trading activity and buying momentum. The recent Base migration and AI-agent narrative around Moonbeam may also be attracting renewed attention.
The biggest signal right now is volume. With GLMR still having a relatively small market cap, increased buying pressure can create very sharp moves.
But this is a highly volatile token, so traders should watch whether the volume stays strong or the pump quickly fades #GLMR/USDT #ZcashETFPostsFirstWeeklyOutflow$93.6M #GreekPoliceBustCryptoScamRingArrest17
$GLMR is making a strong move after a major increase in trading activity and buying momentum. The recent Base migration and AI-agent narrative around Moonbeam may also be attracting renewed attention.
The biggest signal right now is volume. With GLMR still having a relatively small market cap, increased buying pressure can create very sharp moves.
But this is a highly volatile token, so traders should watch whether the volume stays strong or the pump quickly fades #GLMR/USDT #ZcashETFPostsFirstWeeklyOutflow$93.6M #GreekPoliceBustCryptoScamRingArrest17
8

·
--
Liệu Bitcoin có đang trải qua giai đoạn tích lũy hay tích lũy giả? 🧠📉Mặc dù thị trường gần đây chứng kiến nhiều biến động về giá, nhiều nhà phân tích cho rằng diễn biến hiện tại của Bitcoin giống với giai đoạn tích lũy (Accumulation) trước khi bứt phá tiếp theo.
Dưới đây là 3 điểm chính cần được theo dõi ngay lúc này:
1️⃣ Các mức hỗ trợ và kháng cự: Giữ vững các mức hỗ trợ chính sẽ mang lại tín hiệu tích cực cho việc đà tăng tiếp tục diễn ra.
Liệu Bitcoin có đang trải qua giai đoạn tích lũy hay tích lũy giả? 🧠📉
Mặc dù thị trường gần đây chứng kiến nhiều biến động về giá, nhiều nhà phân tích cho rằng diễn biến hiện tại của Bitcoin giống với giai đoạn tích lũy (Accumulation) trước khi bứt phá tiếp theo.
Dưới đây là 3 điểm chính cần được theo dõi ngay lúc này:
1️⃣ Các mức hỗ trợ và kháng cự: Giữ vững các mức hỗ trợ chính sẽ mang lại tín hiệu tích cực cho việc đà tăng tiếp tục diễn ra.
Dưới đây là 3 điểm chính cần được theo dõi ngay lúc này:
1️⃣ Các mức hỗ trợ và kháng cự: Giữ vững các mức hỗ trợ chính sẽ mang lại tín hiệu tích cực cho việc đà tăng tiếp tục diễn ra.
55


Bài viết
NVIDIA Đạt Mức Cao Kỷ Lục, Tăng 2,4%#nvidiahitsrecordhighup2.4%
TÓM TẮT
NVDA lập kỷ lục mới trong ngày ở mức 237,88 USD vào ngày 02/10/2026, trong khi mức đóng cửa chính thức là 233,95 USD, tăng +1,34% so với 230,86 USD
Mức +2,4% được báo cáo đề cập đến mức tăng cao nhất của phiên: cổ phiếu đã thu hồi một phần mức tăng đó trước khi đóng cửa
Diễn biến này phản ánh sức mạnh lan rộng của nhóm AI/bán dẫn và sự tập trung trở lại của nhà đầu tư vào nhu cầu hạ tầng AI của NVIDIA, nhưng đà duy trì trong phiên kế tiếp quan trọng hơn nhiều so với chỉ một kỷ lục trong ngày.
Cập nhật mức kỷ lục mới của NVIDIA
Tính đến thời điểm thị trường Mỹ đóng cửa ngày 2026-10-02, NVIDIA (NVDA) đã đạt mức đỉnh trong ngày cao nhất mọi thời đại mới là 237,88 USD. Cổ phiếu kết thúc ở mức 233,95 USD, tăng +3,09 USD / +1,34% so với mức đóng cửa trước đó là 230,86 USD. Dữ liệu quan hệ nhà đầu tư chính thức của NVIDIA xác nhận đây là mức cao nhất 52 tuần mới.
NVIDIA Đạt Mức Cao Kỷ Lục, Tăng 2,4%
#nvidiahitsrecordhighup2.4%
TÓM TẮT
NVDA lập kỷ lục mới trong ngày ở mức 237,88 USD vào ngày 02/10/2026, trong khi mức đóng cửa chính thức là 233,95 USD, tăng +1,34% so với 230,86 USD
Mức +2,4% được báo cáo đề cập đến mức tăng cao nhất của phiên: cổ phiếu đã thu hồi một phần mức tăng đó trước khi đóng cửa
Diễn biến này phản ánh sức mạnh lan rộng của nhóm AI/bán dẫn và sự tập trung trở lại của nhà đầu tư vào nhu cầu hạ tầng AI của NVIDIA, nhưng đà duy trì trong phiên kế tiếp quan trọng hơn nhiều so với chỉ một kỷ lục trong ngày.
Cập nhật mức kỷ lục mới của NVIDIA
Tính đến thời điểm thị trường Mỹ đóng cửa ngày 2026-10-02, NVIDIA (NVDA) đã đạt mức đỉnh trong ngày cao nhất mọi thời đại mới là 237,88 USD. Cổ phiếu kết thúc ở mức 233,95 USD, tăng +3,09 USD / +1,34% so với mức đóng cửa trước đó là 230,86 USD. Dữ liệu quan hệ nhà đầu tư chính thức của NVIDIA xác nhận đây là mức cao nhất 52 tuần mới.
TÓM TẮT
NVDA lập kỷ lục mới trong ngày ở mức 237,88 USD vào ngày 02/10/2026, trong khi mức đóng cửa chính thức là 233,95 USD, tăng +1,34% so với 230,86 USD
Mức +2,4% được báo cáo đề cập đến mức tăng cao nhất của phiên: cổ phiếu đã thu hồi một phần mức tăng đó trước khi đóng cửa
Diễn biến này phản ánh sức mạnh lan rộng của nhóm AI/bán dẫn và sự tập trung trở lại của nhà đầu tư vào nhu cầu hạ tầng AI của NVIDIA, nhưng đà duy trì trong phiên kế tiếp quan trọng hơn nhiều so với chỉ một kỷ lục trong ngày.
Cập nhật mức kỷ lục mới của NVIDIA
Tính đến thời điểm thị trường Mỹ đóng cửa ngày 2026-10-02, NVIDIA (NVDA) đã đạt mức đỉnh trong ngày cao nhất mọi thời đại mới là 237,88 USD. Cổ phiếu kết thúc ở mức 233,95 USD, tăng +3,09 USD / +1,34% so với mức đóng cửa trước đó là 230,86 USD. Dữ liệu quan hệ nhà đầu tư chính thức của NVIDIA xác nhận đây là mức cao nhất 52 tuần mới.
2
50
·
--
🚨 GIAO DỊCH TĂNG LÃI SUẤT CỦA FED VỪA SỤP ĐỔ — XÁC SUẤT THÁNG 10 GIẢM XUỐNG CÒN 17%.
Sau báo cáo việc làm mới nhất của Mỹ chỉ ghi nhận tăng trưởng bảng lương 29K và tỷ lệ thất nghiệp tăng lên 4,2%, các nhà giao dịch đã cắt mạnh kỳ vọng về một lần Fed tăng lãi suất nữa trong tháng này. Một bản tin nhanh về thị trường ước tính xác suất ở mức gần 17%.
Đây là một bước chuyển lớn so với chỉ vài ngày trước, khi nỗi lo lạm phát do dầu thúc đẩy đã đẩy xác suất tăng lãi suất vào tháng 10 lên trên 70%.
Chuỗi vĩ mô vừa đảo chiều:
Việc làm yếu → xác suất tăng lãi suất thấp hơn → áp lực lợi suất giảm → điều kiện thuận lợi hơn cho tài sản rủi ro.
Vì vậy, điều này quan trọng cho:
$QQQ — cổ phiếu công nghệ được giải tỏa nếu lãi suất ngừng leo thang.
$BTC — các tài sản nhạy với thanh khoản sẽ được hưởng lợi khi áp lực từ Fed hạ nhiệt.
$XAU — vàng có kịch bản “sạch” hơn nếu lợi suất và USD hạ nhiệt.
$TLT — trái phiếu hưởng lợi trực tiếp nếu thị trường định giá ít thắt chặt hơn.
Nhưng đừng nhầm “tạm dừng” với “xoay trục (pivot)”.
Các quan chức Fed vẫn cho rằng lạm phát còn quá cao, và Reuters lưu ý rằng việc tăng lãi suất vào tháng 12 vẫn có thể xảy ra tùy thuộc vào CPI sắp tới và các dữ liệu khác.
Vì vậy, kịch bản giao dịch bây giờ là:
Luận điểm “tạm dừng tháng 10” BẬT.
Sự bất định tháng 12 vẫn còn tồn tại.
$QQQ $BTC $XAU $TLT
#fedoctoberratehikeoddsfallto17% #ZcashETFPostsFirstWeeklyOutflow$93.6M #GreekPoliceBustCryptoScamRingArrest17 #BitcoinRejectedAt$87K #NvidiaHitsRecordHighUp2.4%
🚨 GIAO DỊCH TĂNG LÃI SUẤT CỦA FED VỪA SỤP ĐỔ — XÁC SUẤT THÁNG 10 GIẢM XUỐNG CÒN 17%.
Sau báo cáo việc làm mới nhất của Mỹ chỉ ghi nhận tăng trưởng bảng lương 29K và tỷ lệ thất nghiệp tăng lên 4,2%, các nhà giao dịch đã cắt mạnh kỳ vọng về một lần Fed tăng lãi suất nữa trong tháng này. Một bản tin nhanh về thị trường ước tính xác suất ở mức gần 17%.
Đây là một bước chuyển lớn so với chỉ vài ngày trước, khi nỗi lo lạm phát do dầu thúc đẩy đã đẩy xác suất tăng lãi suất vào tháng 10 lên trên 70%.
Chuỗi vĩ mô vừa đảo chiều:
Việc làm yếu → xác suất tăng lãi suất thấp hơn → áp lực lợi suất giảm → điều kiện thuận lợi hơn cho tài sản rủi ro.
Vì vậy, điều này quan trọng cho:
$QQQ — cổ phiếu công nghệ được giải tỏa nếu lãi suất ngừng leo thang.
$BTC — các tài sản nhạy với thanh khoản sẽ được hưởng lợi khi áp lực từ Fed hạ nhiệt.
$XAU — vàng có kịch bản “sạch” hơn nếu lợi suất và USD hạ nhiệt.
$TLT — trái phiếu hưởng lợi trực tiếp nếu thị trường định giá ít thắt chặt hơn.
Nhưng đừng nhầm “tạm dừng” với “xoay trục (pivot)”.
Các quan chức Fed vẫn cho rằng lạm phát còn quá cao, và Reuters lưu ý rằng việc tăng lãi suất vào tháng 12 vẫn có thể xảy ra tùy thuộc vào CPI sắp tới và các dữ liệu khác.
Vì vậy, kịch bản giao dịch bây giờ là:
Luận điểm “tạm dừng tháng 10” BẬT.
Sự bất định tháng 12 vẫn còn tồn tại.
$QQQ $BTC $XAU $TLT
#fedoctoberratehikeoddsfallto17% #ZcashETFPostsFirstWeeklyOutflow$93.6M #GreekPoliceBustCryptoScamRingArrest17 #BitcoinRejectedAt$87K #NvidiaHitsRecordHighUp2.4%
Sau báo cáo việc làm mới nhất của Mỹ chỉ ghi nhận tăng trưởng bảng lương 29K và tỷ lệ thất nghiệp tăng lên 4,2%, các nhà giao dịch đã cắt mạnh kỳ vọng về một lần Fed tăng lãi suất nữa trong tháng này. Một bản tin nhanh về thị trường ước tính xác suất ở mức gần 17%.
Đây là một bước chuyển lớn so với chỉ vài ngày trước, khi nỗi lo lạm phát do dầu thúc đẩy đã đẩy xác suất tăng lãi suất vào tháng 10 lên trên 70%.
Chuỗi vĩ mô vừa đảo chiều:
Việc làm yếu → xác suất tăng lãi suất thấp hơn → áp lực lợi suất giảm → điều kiện thuận lợi hơn cho tài sản rủi ro.
Vì vậy, điều này quan trọng cho:
$QQQ — cổ phiếu công nghệ được giải tỏa nếu lãi suất ngừng leo thang.
$BTC — các tài sản nhạy với thanh khoản sẽ được hưởng lợi khi áp lực từ Fed hạ nhiệt.
$XAU — vàng có kịch bản “sạch” hơn nếu lợi suất và USD hạ nhiệt.
$TLT — trái phiếu hưởng lợi trực tiếp nếu thị trường định giá ít thắt chặt hơn.
Nhưng đừng nhầm “tạm dừng” với “xoay trục (pivot)”.
Các quan chức Fed vẫn cho rằng lạm phát còn quá cao, và Reuters lưu ý rằng việc tăng lãi suất vào tháng 12 vẫn có thể xảy ra tùy thuộc vào CPI sắp tới và các dữ liệu khác.
Vì vậy, kịch bản giao dịch bây giờ là:
Luận điểm “tạm dừng tháng 10” BẬT.
Sự bất định tháng 12 vẫn còn tồn tại.
$QQQ $BTC $XAU $TLT
#fedoctoberratehikeoddsfallto17% #ZcashETFPostsFirstWeeklyOutflow$93.6M #GreekPoliceBustCryptoScamRingArrest17 #BitcoinRejectedAt$87K #NvidiaHitsRecordHighUp2.4%

192

·
--
Super ($SUPER) tăng 6,04% với vị trí trong biên độ cao ở mức 88,8% và biến động ở mức vừa phải. Worldcoin ($WLD) bứt phá 10,56%, khối lượng 93,6M, động lượng 22,3, biến động 18,6, đảo chiều 19,2. Injective ($INJ) tăng 2,25%, động lượng thấp, biến động thấp. Thiết lập mạnh nhất là $WLD: lợi nhuận tiềm năng cao, khối lượng cao, động lượng mạnh. Theo dõi nếu giá vẫn duy trì trên 0,5901; rủi ro đảo chiều nếu động lượng chững lại.
Super ($SUPER ) tăng 6,04% với vị trí trong biên độ cao ở mức 88,8% và biến động ở mức vừa phải. Worldcoin ($WLD ) bứt phá 10,56%, khối lượng 93,6M, động lượng 22,3, biến động 18,6, đảo chiều 19,2. Injective ($INJ ) tăng 2,25%, động lượng thấp, biến động thấp. Thiết lập mạnh nhất là $WLD : lợi nhuận tiềm năng cao, khối lượng cao, động lượng mạnh. Theo dõi nếu giá vẫn duy trì trên 0,5901; rủi ro đảo chiều nếu động lượng chững lại.
79

·
--
Bạn đứng ở đâu về $ETH?
Tăng giá
Giảm giá
Một con cá voi đã mở một lệnh long trị giá 93,6 triệu USD.
BlackRock và các ETF khác đã bán ETH trị giá 59,58 triệu USD.
Bình luận lựa chọn của bạn: tăng giá hay giảm giá.
Không phải lời khuyên tài chính. Hãy tự nghiên cứu (DYOR).
Bạn đứng ở đâu về $ETH?
Tăng giá
Giảm giá
Một con cá voi đã mở một lệnh long trị giá 93,6 triệu USD.
BlackRock và các ETF khác đã bán ETH trị giá 59,58 triệu USD.
Bình luận lựa chọn của bạn: tăng giá hay giảm giá.
Không phải lời khuyên tài chính. Hãy tự nghiên cứu (DYOR).
Tăng giá
Giảm giá
Một con cá voi đã mở một lệnh long trị giá 93,6 triệu USD.
BlackRock và các ETF khác đã bán ETH trị giá 59,58 triệu USD.
Bình luận lựa chọn của bạn: tăng giá hay giảm giá.
Không phải lời khuyên tài chính. Hãy tự nghiên cứu (DYOR).

56

Xem bản dịch
BREAKING:
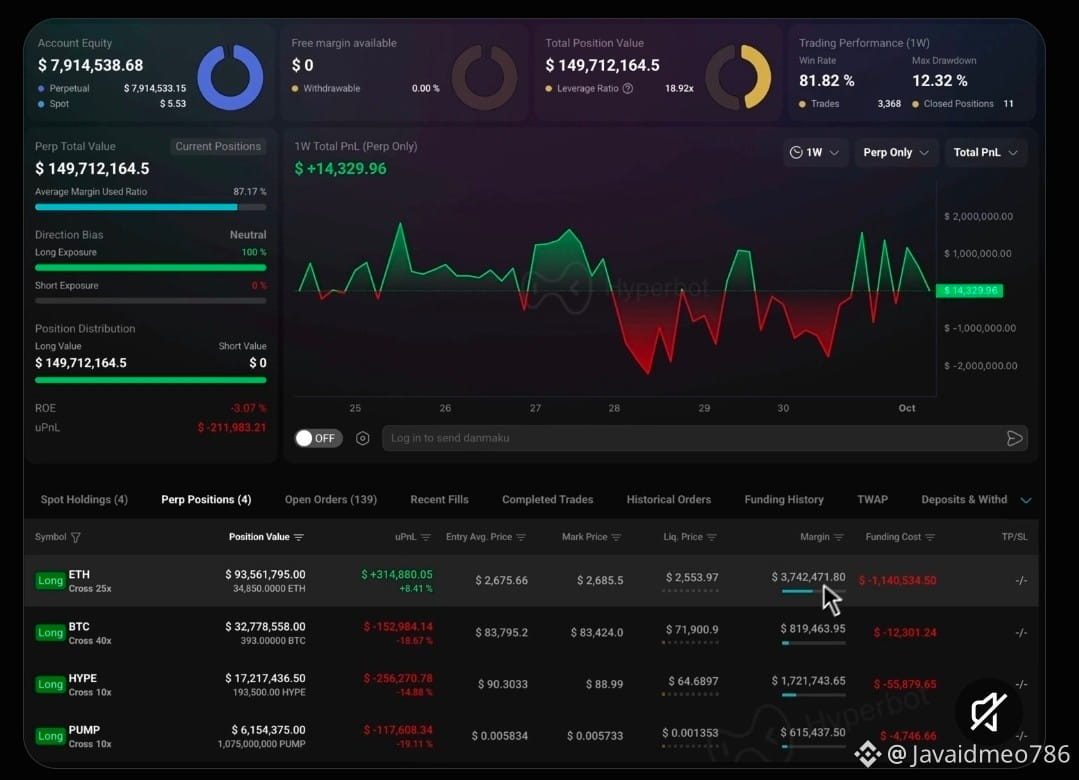
A whale with a 100% win rate has opened a $93.6M $ETH long, a $32.8M $BTC long, a $17.2M $HYPE long and a $6.2M $PUMP long.
🦥🦥#MetaMaskExitsLidoValidatorsAfterSecurityIncident
BREAKING:
A whale with a 100% win rate has opened a $93.6M $ETH long, a $32.8M $BTC long, a $17.2M $HYPE long and a $6.2M $PUMP long.
🦥🦥#MetaMaskExitsLidoValidatorsAfterSecurityIncident
A whale with a 100% win rate has opened a $93.6M $ETH long, a $32.8M $BTC long, a $17.2M $HYPE long and a $6.2M $PUMP long.
🦥🦥#MetaMaskExitsLidoValidatorsAfterSecurityIncident
AngelOfCrypto_-:
nice
1
1
298

·
--
Xem bản dịch
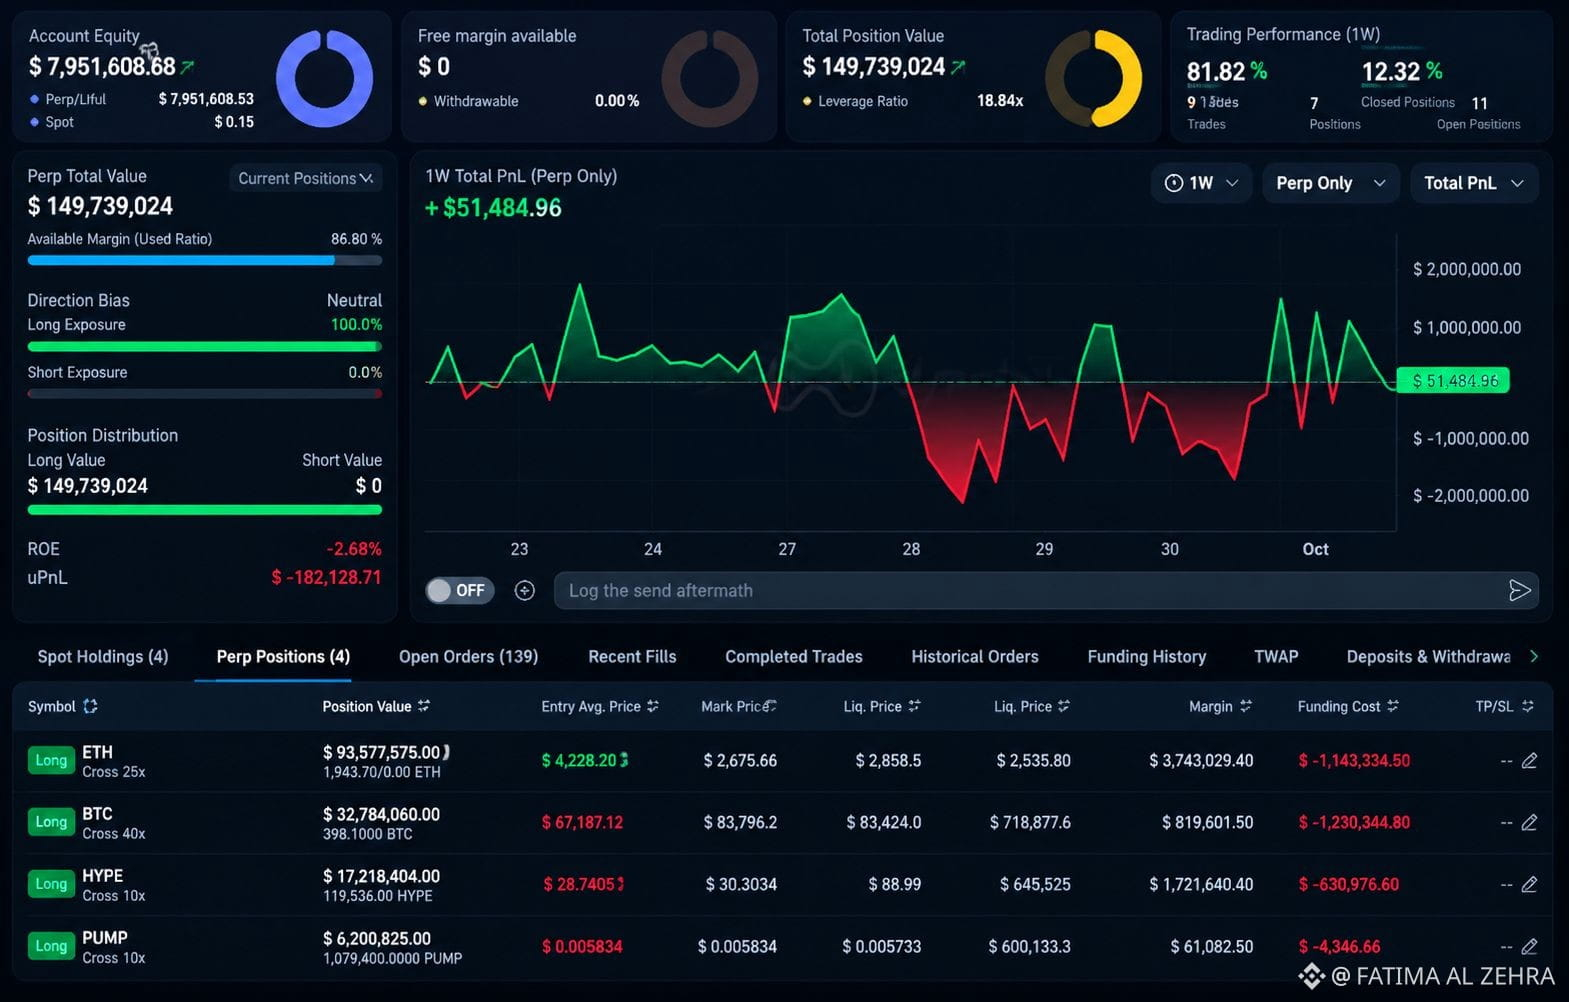
🚨 A $150M+ WHALE JUST WENT HEAVILY LONG. 👀
While the crypto market is full of fear and uncertainty, one whale is reportedly betting BIG on a recovery.
🐋 $93.6M ETH LONG
₿ $32.8M BTC LONG
🔥 $17.2M HYPE LONG
🚀 $6.2M PUMP LONG
That’s roughly $150M+ in long exposure. 🤯
And the biggest question is:
WHAT DOES THIS WHALE SEE THAT THE REST OF THE MARKET DOESN’T? 👀
Is this smart money positioning for a bounce… or a massive leveraged gamble?
BULLISH SIGNAL OR TRAP? 🐋📈📉
#Bitcoin #Ethereum #Crypto #Trading #CryptoMarket $BTC $ETH $MOVR
🚨 A $150M+ WHALE JUST WENT HEAVILY LONG. 👀
While the crypto market is full of fear and uncertainty, one whale is reportedly betting BIG on a recovery.
🐋 $93.6M ETH LONG
₿ $32.8M BTC LONG
🔥 $17.2M HYPE LONG
🚀 $6.2M PUMP LONG
That’s roughly $150M+ in long exposure. 🤯
And the biggest question is:
WHAT DOES THIS WHALE SEE THAT THE REST OF THE MARKET DOESN’T? 👀
Is this smart money positioning for a bounce… or a massive leveraged gamble?
BULLISH SIGNAL OR TRAP? 🐋📈📉
#Bitcoin #Ethereum #Crypto #Trading #CryptoMarket $BTC $ETH $MOVR
While the crypto market is full of fear and uncertainty, one whale is reportedly betting BIG on a recovery.
🐋 $93.6M ETH LONG
₿ $32.8M BTC LONG
🔥 $17.2M HYPE LONG
🚀 $6.2M PUMP LONG
That’s roughly $150M+ in long exposure. 🤯
And the biggest question is:
WHAT DOES THIS WHALE SEE THAT THE REST OF THE MARKET DOESN’T? 👀
Is this smart money positioning for a bounce… or a massive leveraged gamble?
BULLISH SIGNAL OR TRAP? 🐋📈📉
#Bitcoin #Ethereum #Crypto #Trading #CryptoMarket $BTC $ETH $MOVR
209

·
--
Một con cá voi với tỷ lệ thắng 100% đã mở một lệnh LONG trị giá 93,6M USD $ETH , một lệnh LONG trị giá 32,8M USD $BTC, một lệnh LONG trị giá 17,2M $HOT và một lệnh LONG trị giá 6,2M USD $PUMP.
Liệu anh ấy có biết điều gì đó không?
Một con cá voi với tỷ lệ thắng 100% đã mở một lệnh LONG trị giá 93,6M USD $ETH , một lệnh LONG trị giá 32,8M USD $BTC, một lệnh LONG trị giá 17,2M $HOT và một lệnh LONG trị giá 6,2M USD $PUMP.
Liệu anh ấy có biết điều gì đó không?
Liệu anh ấy có biết điều gì đó không?
209
Đăng nhập để khám phá thêm nội dung
Tham gia cùng người dùng tiền mã hóa toàn cầu trên Binance Square
⚡️ Nhận thông tin mới nhất và hữu ích về tiền mã hóa.
💬 Được tin cậy bởi sàn giao dịch tiền mã hóa lớn nhất thế giới.
👍 Khám phá những thông tin chuyên sâu thực tế từ những nhà sáng tạo đã xác minh.
Email / Số điện thoại
Chủ đề thịnh hành
1
#TinFed
101,598 lượt xem
464 đang thảo luận
2
#TheoDõiFOMC
117,655 lượt xem
667 đang thảo luận
3
#ZcashETFPostsFirstWeeklyOutflow$93.6M
85 lượt xem
25 đang thảo luận
4
#GreekPoliceBustCryptoScamRingArrest17
585 lượt xem
83 đang thảo luận
5
#BitcoinRejectedAt$87K
52,266 lượt xem
91 đang thảo luận
6
#FedOctoberRateHikeOddsFallTo17%
28,890 lượt xem
487 đang thảo luận
7
#NvidiaHitsRecordHighUp2.4%
11,819 lượt xem
324 đang thảo luận
8
#CanaryFilesAmendedS1ForPEPEETF
6,224 lượt xem
227 đang thảo luận
9
#USRussiaUkraineTalksReportedlyIncludeLukoilOilDeal
15,408 lượt xem
295 đang thảo luận
10
#BitcoinParesGainsAfterRallyTo$86.5K
39,745 lượt xem
151 đang thảo luận