
Author: Yashu Gola, Cointelegraph; Translated by: Song Xue, Golden Finance
The price of Ethereum’s native token, Ether, has risen by about 35% so far in 2023. But its attempts to break through the psychological resistance level of $2,000 have been met with strong bearish rejections on multiple occasions.
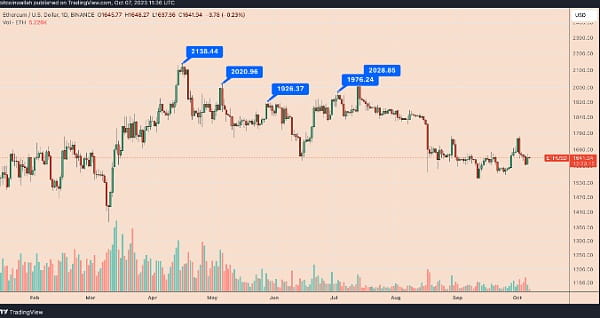
ETH/USD daily price chart. Source: TradingView
Let’s take a closer look at three possible reasons why the Ethereum price has failed to decisively reclaim $2,000 since May 2022.
Ethereum Price Draws Bear Cycle Fractal
Ethereum’s inability to break above $2,000 in 2023 would resemble the bearish rejection around $425 in 2018-2019.
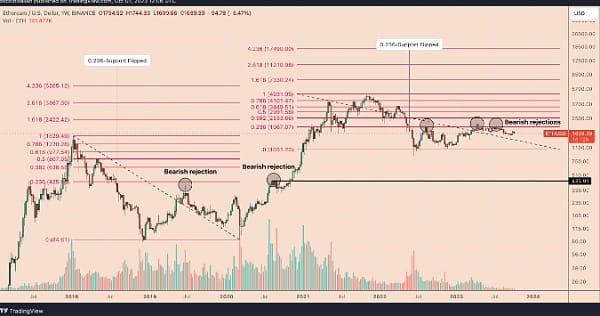
ETH/USD weekly price chart. Source: TradingView
In both cases, Ethereum appears to be in a recovery phase while keeping an eye on the Fibonacci retracement chart above the 0.236 Fib level.
In 2018-2019, the 0.236 Fibonacci line near $425 would limit Ethereum's recovery attempts. In 2023, the same line near $2,000 would again become a selling zone, thus depressing ETH's price.
Dollar, Bitcoin strengthen
A stronger U.S. dollar has dampened demand for Ethereum in recent months, reducing its ability to close decisively above $2,000.
The prevailing negative correlation between the top cryptocurrencies and the U.S. dollar is to blame. In particular, in 2023, the weekly correlation coefficient between Ethereum and the U.S. Dollar Index (DXY) has been negative, as shown in the figure below.
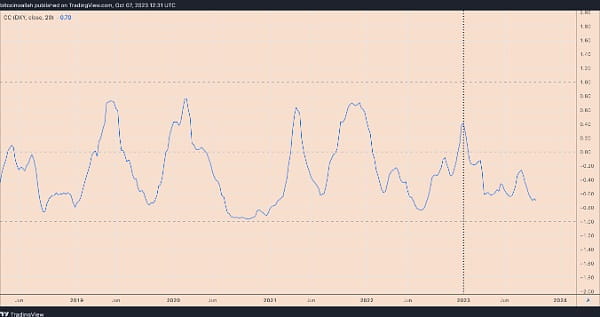
ETH/USD and DXY weekly correlation chart. Source: TradingView
Meanwhile, Ethereum has largely underperformed Bitcoin in 2023, thanks to the ongoing hype surrounding spot Bitcoin ETFs. For example, the widely tracked ETH/BTC trading pair is down 20% year to date (YTD).
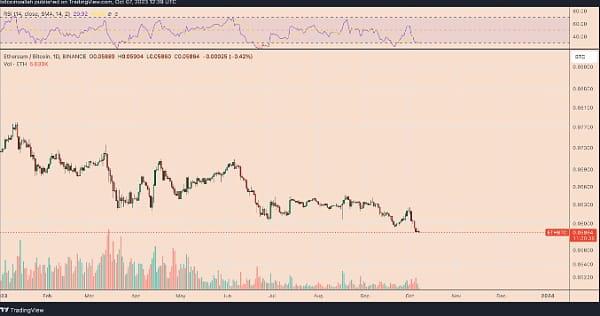
ETH/BTC daily price chart. Source: TradingView
Furthermore, according to CoinShares’ weekly report, Ethereum-related investment funds have seen net capital holdings fall by $114 million so far in 2023. In contrast, Bitcoin-based funds have attracted $168 million over the same period.
Ethereum network activity drops
The total value locked (TVL) of the entire Ethereum ecosystem has fallen from 18.41 million ETH to 12.79 million ETH as of 2023. As JPMorgan analysts also recently warned, this highlights the reduced availability of funds, resulting in lower returns for investors.
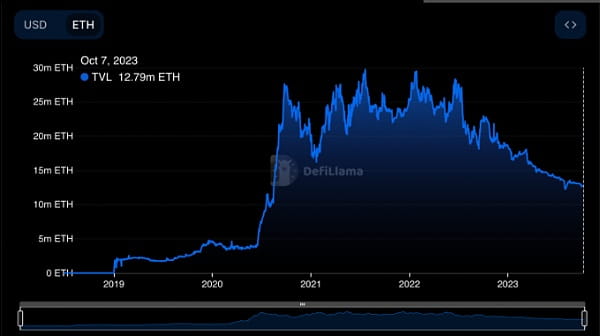
Ethereum TVL since 2019. Source: Defi Llama
The decline in TVL was accompanied by a drop in gas fees on the Ethereum network, which reached a yearly low on October 5.
Ethereum’s NFT volume and unique active wallets have also fallen by 30% and 16.5% over the past 30 days, according to Dapp Radar.
These include declines in key metrics for popular applications, including decentralized exchange Uniswap V2, DEX aggregator 1inch Network, Ethereum staking provider Lido, and more.
Ethereum Technical Analysis
Meanwhile, Ethereum price technicals suggest that it could rebound to the 50-day exponential moving average (50-EMA; red wave) near $1,665.
However, from a broad perspective, ETH/USD has been trapped in a persistent bearish pattern known as an ascending triangle.
Therefore, if the lower trendline of the triangle is broken, the price has the potential to plummet as much as the maximum height of the pattern. In this case, the price of ETH could drop to $1,465 and $1,560 in October 2023, depending on the breakdown point.
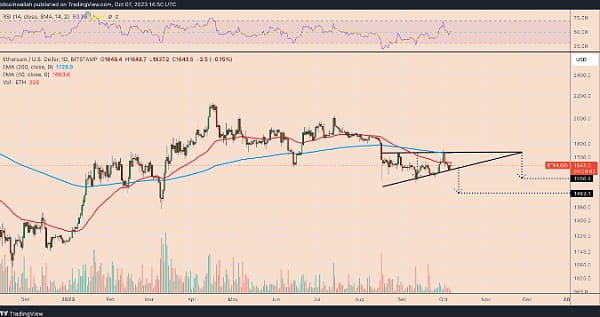
ETH/USD daily price chart. Source: TradingView
In the short term, a breakout above the 50-day MA could carry ETH’s price to the upper trendline of the triangle near $1,730 in October 2023, which coincides with the 200-day MA (blue wave).