



On October 8, 2026, the Raydium price trades at $2.51 on Binance, supported by a bullish daily structure above all three tracked moving averages. The uptrend remains dominant, but hourly momentum recovery is still incomplete, keeping the breakout from being confirmed.
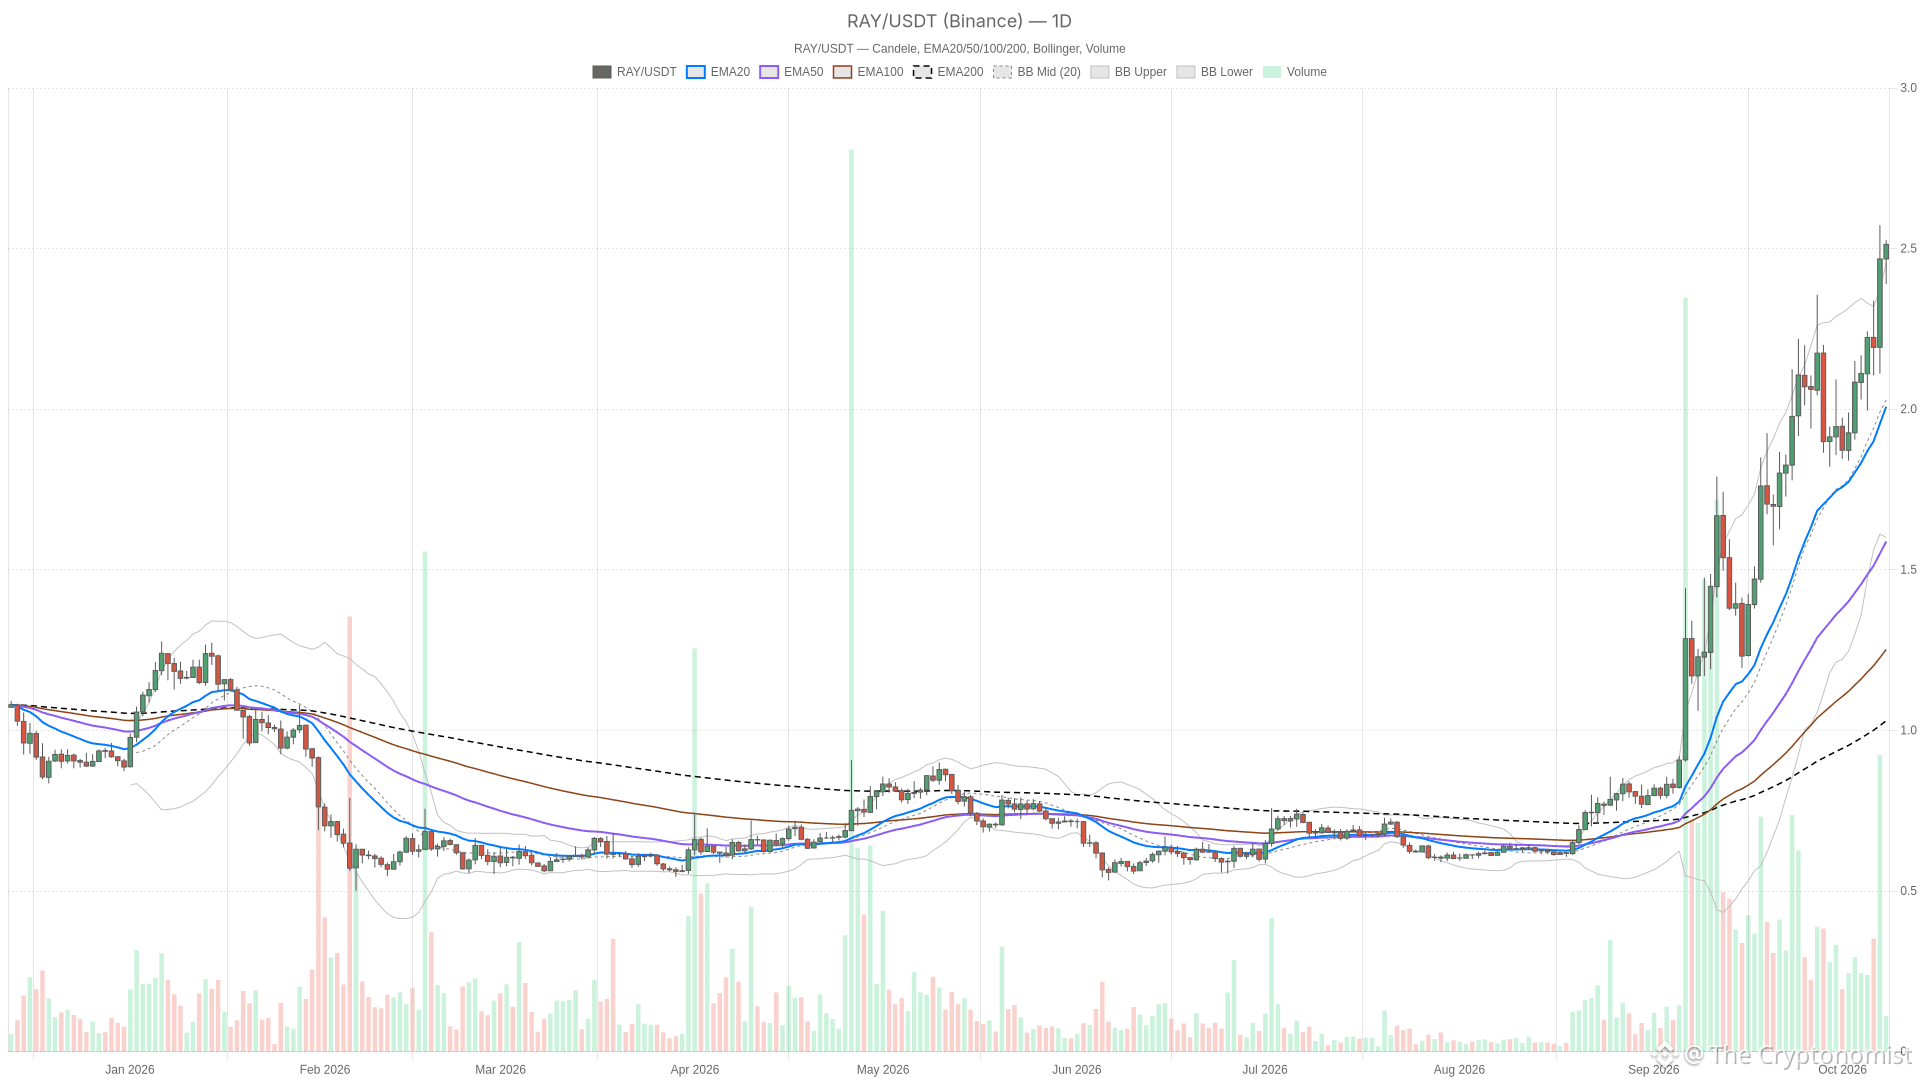 RAY/USDT — daily chart with candlesticks, EMA20/EMA50 and volume.
Key takeaways
Raydium trades at $2.51 with daily moving averages in bullish alignment: EMA20 at $1.95, EMA50 at $1.55, and EMA200 at $1.02.
Daily RSI sits at 74.5 in overbought territory, while the hourly MACD histogram remains negative but is steadily narrowing.
Hourly R1 at $2.53 is the immediate breakout trigger; the hourly pivot at $2.49 is the key support to hold.
Crypto market sentiment reads Greed (64), with total market capitalization at $2.83 trillion and Bitcoin dominance at 58.77%.
Raydium price has daily strength but incomplete hourly confirmation
The daily chart defines the main scenario as bullish, but the hourly chart has not yet confirmed the move with positive momentum. The last completed daily candle closed at $2.47, while the live daily price trades at $2.51. Its positive MACD histogram supports continuation, yet the hourly histogram remains negative despite improving across the last three completed readings. Direction and momentum are therefore not fully synchronized.
The 15-minute chart provides constructive execution context rather than a separate macro signal. Its live price is also $2.51, with a positive and widening MACD histogram. This short-term strength supports another resistance test. However, it cannot by itself settle the disagreement between daily momentum and the still-negative hourly histogram.
Aligned averages support the trend, while Bollinger extension raises pullback risk
Moving averages across all timeframes are in bullish alignment, but price sitting above the daily upper Bollinger Band signals elevated pullback risk. Binance candle data places price above the daily EMA20 at $1.95, EMA50 at $1.55 and EMA200 at $1.02. The averages maintain a textbook bullish order.
The hourly structure agrees: price is above the EMA20 at $2.42, EMA50 at $2.33 and EMA200 at $2.15, also in bullish order. On the 15-minute chart, price sits above the EMA20 at $2.47, EMA50 at $2.45 and EMA200 at $2.33, with the same alignment. This consistency across timeframes gives the trend a stronger foundation than momentum alone provides.
The Bollinger picture is more stretched. Daily price is above the daily upper band at $2.37, with the daily midpoint at $1.99 and lower band at $1.61. The upper band now lies below price and acts as a potential support reference, not overhead resistance. A retreat toward it would represent mean reversion within an otherwise bullish structure.
Hourly price remains inside bands spanning $2.38 to $2.54, above their $2.46 midpoint. The 15-minute bands span $2.40 to $2.52, with a $2.46 midpoint, and price is near the upper edge. Both shorter horizons place the immediate advance near their upper boundaries rather than near the center of the range.
ATR is $0.22 on the daily chart, $0.07 hourly and $0.03 on the 15-minute chart. These readings describe the scale of candle movement, not its direction. Nearby intraday levels therefore need confirmation through completed candles rather than a brief touch.
Overbought daily RSI meets a recovering hourly MACD
Daily RSI at 74.5 signals overbought conditions, while the hourly MACD histogram, though still negative, is steadily narrowing. Daily RSI is rising across the supplied completed readings, placing it firmly in overbought territory. Meanwhile, hourly RSI is rising at 62.6, and 15-minute RSI sits at 62.1 with a mixed recent sequence. Strength is evident across all horizons, but only the daily reading is overbought. The shorter charts do not yet show the same degree of stretch.
Daily MACD has crossed into a positive histogram across the last three completed candles. The hourly histogram remains negative but is narrowing, indicating that the momentum drag is easing without having disappeared. The 15-minute histogram is positive and widening. Together, these readings favor a bullish test while leaving hourly confirmation unfinished.
Hourly $2.53 resistance and $2.49 support define the scenarios
A confirmed breakout requires an hourly close above $2.53, while a close below $2.49 would open the door to a pullback. The nearest listed overhead level is hourly R1 at $2.53, followed by the hourly Bollinger upper band at $2.54. The nearest listed support is the hourly pivot at $2.49. The last completed hourly candle closed at $2.50, between those boundaries, so neither scenario trigger has been satisfied.
Bullish scenario: an hourly close above hourly R1 at $2.53 would confirm a local breakout. Beyond the hourly upper band, daily R1 at $2.66 is the next listed daily resistance. This scenario would be invalidated by an hourly close below the hourly pivot at $2.49. The likeliest false bullish signal is an intrabar push above hourly R1 that fails to hold on the completed candle. Daily RSI already being overbought adds to this risk.
Bearish scenario: an hourly close below the hourly pivot at $2.49 would trigger a local pullback. The initial targets are the hourly Bollinger midpoint at $2.46 and hourly S1 at $2.45. A deeper retreat would bring the daily pivot at $2.38 into focus, ahead of the daily upper Bollinger band at $2.37 and daily S1 at $2.19. An hourly close above hourly R1 at $2.53 would invalidate this bearish setup. Its principal false-signal risk is a temporary pivot break within the still-aligned bullish trend, rather than the start of a daily reversal.
Greed provides context, not confirmation of a RAY breakout
The Fear & Greed Index at 64 reflects risk appetite across crypto, but it does not confirm a Raydium-specific breakout. Alternative.me classifies this reading as Greed. CoinGecko places total crypto market capitalization at $2.83 trillion and Bitcoin dominance at 58.77%. The sentiment reading provides a risk-appetite backdrop, but these broad-market levels do not establish asset-specific demand or confirm the breakout scenario for Raydium.
FAQ
Is the main RAY scenario bullish or bearish?
Bullish on the daily chart. All three tracked daily averages are below price and in bullish order, although the overbought daily RSI adds pullback risk.
Does the 15-minute momentum settle the hourly disagreement?
No. Its positive, widening histogram provides constructive execution context, but the hourly histogram remains negative. The shorter reading does not replace the hourly closing-price trigger.
Do these figures describe completed candles?
The quoted trading price is live. The moving averages, momentum indicators and pivots are calculated from completed candles, so the current price is not a confirmed candle close.
Disclaimer: This article is for informational purposes only and does not constitute financial advice, an investment recommendation, or a solicitation to buy or sell any financial instrument or cryptocurrency. The analysis provided is not indicative of future results. Investing in crypto assets and financial markets carries a high risk of capital loss. Always do your own research (DYOR) and consult a qualified financial advisor before making any decision.
Article produced with the assistance of artificial intelligence and reviewed by the editorial team.