

What Played Out
On January 31, 2026, I published the original PEPE analysis as a textbook Elliott Wave case study.
245 days later, the larger structure is still playing out.
The original analysis projected a prolonged corrective phase following the previous major advance, with the forecasted bottom developing within the lower Fibonacci retracement area.
That correction has now extended into the projected bottom region.
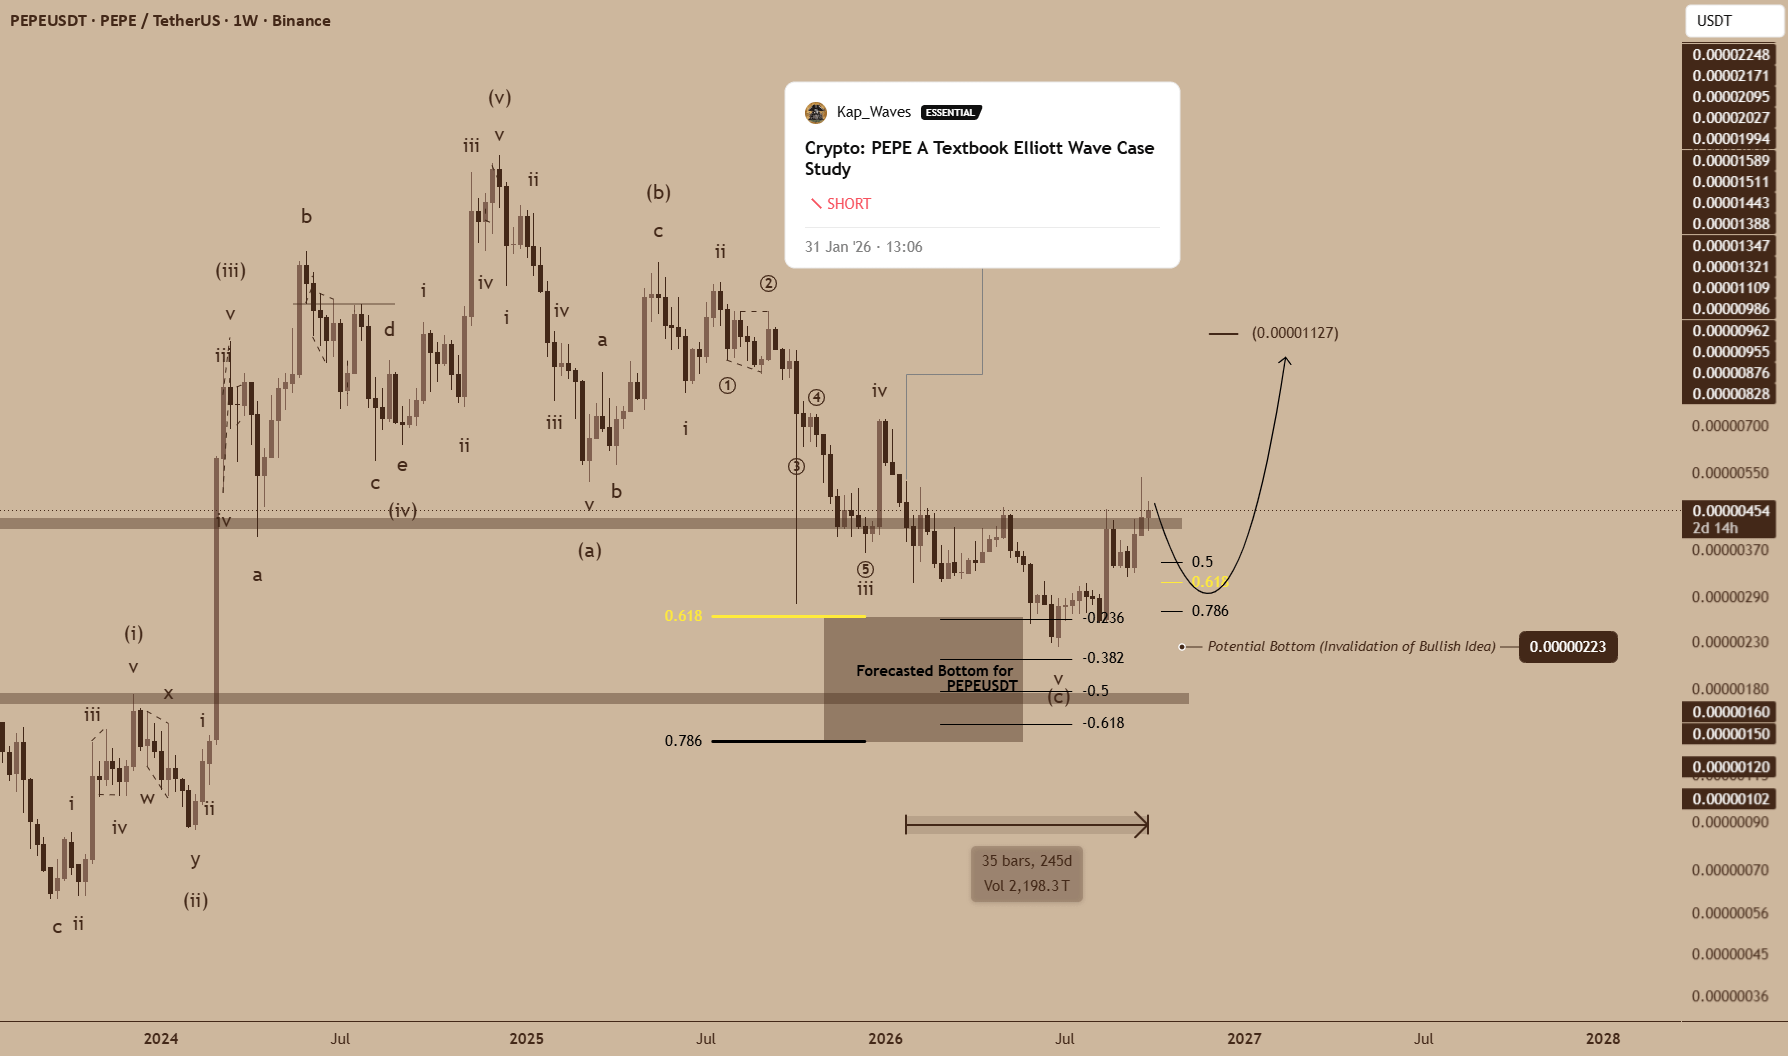
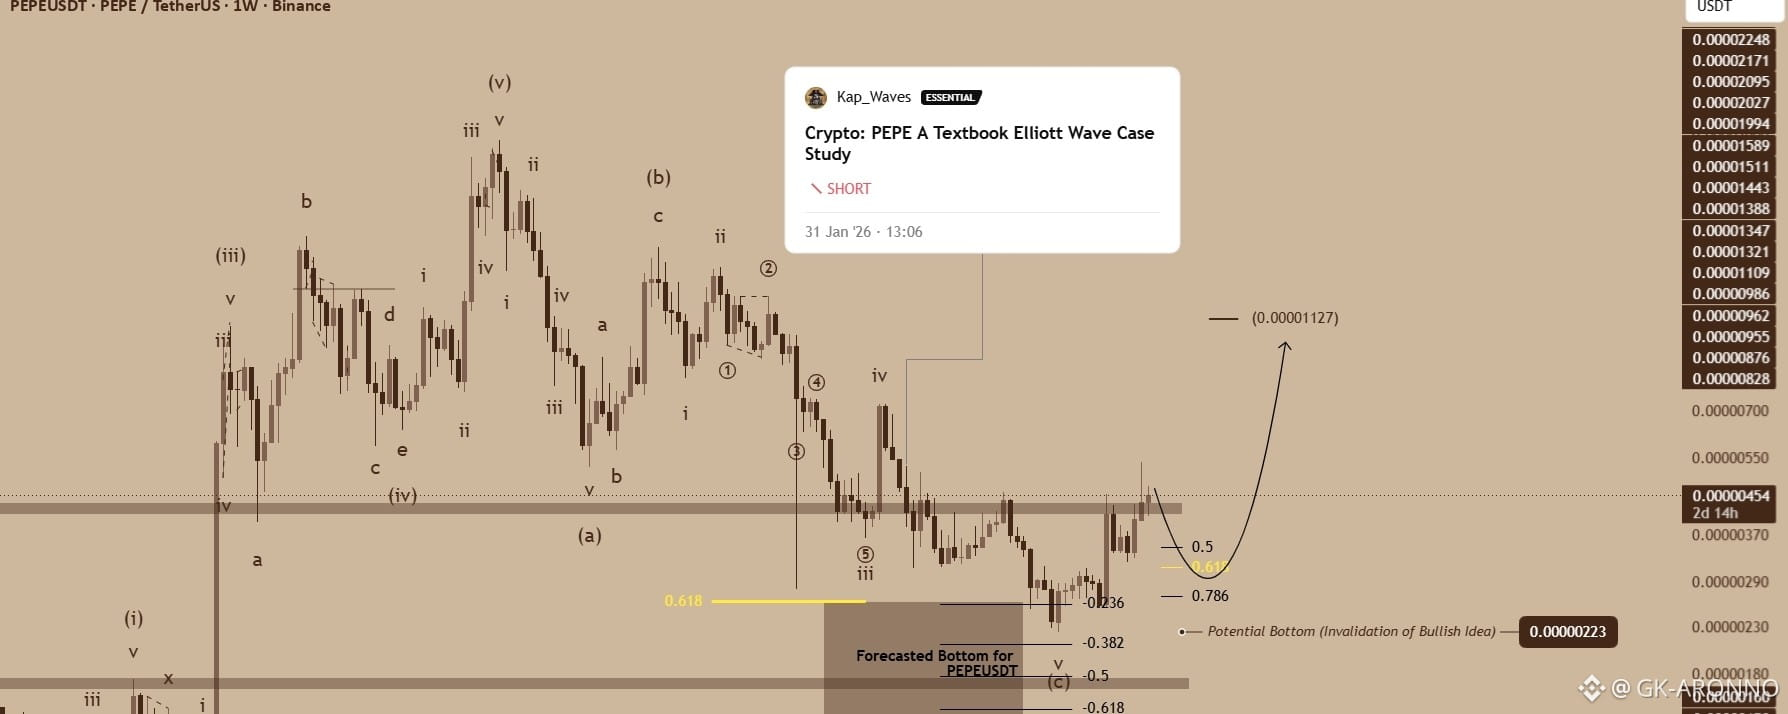
More importantly, PEPE has already traded down toward the $0.00000223 potential-bottom level marked on the original structure.
This does not prove that the final low is in but it puts the market at a very different point from where the original analysis began.
The question is no longer simply whether PEPE can complete the correction.
It is whether the correction has already bottomed.
Current Structure
The latest weekly chart shows PEPE around $0.00000455, following a significant recovery from the lows.
The projected structure continues to favor the possibility that the long corrective sequence is approaching completion.
The chart identifies $0.00000223 as the potential bottom / invalidation level for the bullish idea.
Price has already traded close to that area and subsequently recovered.
That is important because the current structure is now showing the characteristics of a possible transition from the long corrective phase into a new bullish sequence.
The projected upside path points toward approximately $0.00001127.
However, the chart still allows for another retracement before that larger move develops. The Fibonacci levels around the current structure include the 0.5, 0.618 and 0.786 retracement areas.
What Happens Next
The chart's forward projection is notably different from the previous phase.
Instead of another large corrective decline being the primary expectation, the current setup allows for a bullish scenario following the potential bottom.
The projected timeframe is broad:
105–445 days.
That means the bullish case should be viewed as a long-duration structural projection, not a short-term price target.
From the current structure, PEPE could continue building a base before developing the larger impulsive move toward the projected $0.00001127 area.
Primary Scenario
The primary scenario is that PEPE has either already established, or is very close to establishing, the potential bottom of the larger correction.
If the bullish structure continues to hold, the market could transition into a prolonged advance over the next 105 to 445 days.
The key upside projection shown on the chart is:
$0.00001127
The important part of this setup is not the speed of the move.
It is whether PEPE can maintain the structure required for the larger bullish count to develop.
Invalidation
The critical level remains:
$0.00000223
This is explicitly marked on the chart as the Potential Bottom / Invalidation of Bullish Idea.
A sustained break below this level would weaken the bullish interpretation and indicate that the assumed bottom was premature.
Until then, the larger bullish scenario remains technically viable.
Fundamental Context
PEPE does not currently have a clear project-specific fundamental catalyst driving this structure.
Recent price action has instead been closely associated with broader crypto risk appetite and rotation into meme coins. PEPE surged during the September crypto rebound and significantly outperformed during periods of Bitcoin strength and meme-coin rotation.
More recently, PEPE has been consolidating after its September rally. Market coverage has highlighted the absence of a single PEPE-specific catalyst, with broader market flows and speculative positioning appearing more important to the recent move.
That distinction matters here.
Fundamentals are not what validates the Elliott Wave count. The chart is showing the structural possibility of a bottom.
Kap Waves Outlook
245 days after the original forecast, the PEPE structure remains remarkably consistent with the larger corrective thesis.
The market has now reached the area where the chart identified a potential bottom.
The next phase is the important one.
If $0.00000223 continues to hold, the bullish scenario remains viable, with the chart projecting a potential advance toward $0.00001127 over a 105–445 day horizon.
The potential bottom may already be in. Now the market has to prove it.
$PEPE