
#weeklycrypto
weeklycrypto
1,633 переглядів
17 обговорюють
Популярні
Найсвіжіші

📊 Щотижневий огляд крипторинку: структура ринку, ліквідність і висновки тижня
Ще один тиждень навчання про криптовалюти добігає кінця. Перш ніж перейти до наступного тижня, розгляньмо три важливі поняття, які допомагають зрозуміти ринок не лише через щоденні зміни цін.
🔹 1. Структура ринку
Структура ринку допомагає визначити, чи ринок рухається вгору, вниз або вбік.
Вищі максимуми й вищі мінімуми можуть свідчити про висхідну структуру, тоді як нижчі максимуми й нижчі мінімуми можуть вказувати на тиск продавців.
Однак жодна структура не залишається незмінною назавжди. Завжди враховуйте ширший часовий горизонт.
🔹 2. Ліквідність
Ліквідність відіграє важливу роль у тому, як ціни реагують поблизу ключових рівнів.
Попередні максимуми й мінімуми, глибина книги ордерів та торгова активність можуть надати корисну інформацію.
Зняття ліквідності автоматично не підтверджує розворот. Варто звернути увагу на подальшу реакцію ціни.
🔹 3. Ціна й обсяг
Ціна показує рух ринку, а обсяг надає інформацію про участь у торгах.
Пробій ціни, що супроводжується збільшенням обсягу, може дати додатковий контекст, але не гарантує продовження руху.
🔹 4. Психологія ринку
Страх, жадібність, FOMO та надмірна самовпевненість можуть впливати на рішення.
Послідовний дослідницький підхід і розуміння власної толерантності до ризику можуть допомогти зменшити кількість рішень, зумовлених емоціями.
🔹 5. Три висновки, які варто запам’ятати
✅ Ніколи не оцінюйте рух цін лише за одним індикатором.
✅ Перш ніж інтерпретувати пробій, розберіться в ліквідності та структурі ринку.
✅ Зосередьтеся на дослідженні, усвідомленні ризиків і терпінні, а не на емоційних реакціях.
📌 Головний висновок тижня:
Структура ринку пояснює напрямок руху, ліквідність дає контекст, обсяг допомагає оцінити участь у торгах, а психологія впливає на рішення.
Розуміння того, як ці чинники взаємодіють, цінніше за спроби встигнути за кожним рухом ринку.
💬 Запитання: Яка тема цього тижня допомогла вам краще зрозуміти крипторинки?
Лише освітній контент. Не є фінансовою порадою.
#WeeklyCrypto #bitcoin #Marketstructure #CryptoEducatio
📊 Щотижневий огляд крипторинку: структура ринку, ліквідність і висновки тижня
Ще один тиждень навчання про криптовалюти добігає кінця. Перш ніж перейти до наступного тижня, розгляньмо три важливі поняття, які допомагають зрозуміти ринок не лише через щоденні зміни цін.
🔹 1. Структура ринку
Структура ринку допомагає визначити, чи ринок рухається вгору, вниз або вбік.
Вищі максимуми й вищі мінімуми можуть свідчити про висхідну структуру, тоді як нижчі максимуми й нижчі мінімуми можуть вказувати на тиск продавців.
Однак жодна структура не залишається незмінною назавжди. Завжди враховуйте ширший часовий горизонт.
🔹 2. Ліквідність
Ліквідність відіграє важливу роль у тому, як ціни реагують поблизу ключових рівнів.
Попередні максимуми й мінімуми, глибина книги ордерів та торгова активність можуть надати корисну інформацію.
Зняття ліквідності автоматично не підтверджує розворот. Варто звернути увагу на подальшу реакцію ціни.
🔹 3. Ціна й обсяг
Ціна показує рух ринку, а обсяг надає інформацію про участь у торгах.
Пробій ціни, що супроводжується збільшенням обсягу, може дати додатковий контекст, але не гарантує продовження руху.
🔹 4. Психологія ринку
Страх, жадібність, FOMO та надмірна самовпевненість можуть впливати на рішення.
Послідовний дослідницький підхід і розуміння власної толерантності до ризику можуть допомогти зменшити кількість рішень, зумовлених емоціями.
🔹 5. Три висновки, які варто запам’ятати
✅ Ніколи не оцінюйте рух цін лише за одним індикатором.
✅ Перш ніж інтерпретувати пробій, розберіться в ліквідності та структурі ринку.
✅ Зосередьтеся на дослідженні, усвідомленні ризиків і терпінні, а не на емоційних реакціях.
📌 Головний висновок тижня:
Структура ринку пояснює напрямок руху, ліквідність дає контекст, обсяг допомагає оцінити участь у торгах, а психологія впливає на рішення.
Розуміння того, як ці чинники взаємодіють, цінніше за спроби встигнути за кожним рухом ринку.
💬 Запитання: Яка тема цього тижня допомогла вам краще зрозуміти крипторинки?
Лише освітній контент. Не є фінансовою порадою.
#WeeklyCrypto #bitcoin #Marketstructure #CryptoEducatio
Ще один тиждень навчання про криптовалюти добігає кінця. Перш ніж перейти до наступного тижня, розгляньмо три важливі поняття, які допомагають зрозуміти ринок не лише через щоденні зміни цін.
🔹 1. Структура ринку
Структура ринку допомагає визначити, чи ринок рухається вгору, вниз або вбік.
Вищі максимуми й вищі мінімуми можуть свідчити про висхідну структуру, тоді як нижчі максимуми й нижчі мінімуми можуть вказувати на тиск продавців.
Однак жодна структура не залишається незмінною назавжди. Завжди враховуйте ширший часовий горизонт.
🔹 2. Ліквідність
Ліквідність відіграє важливу роль у тому, як ціни реагують поблизу ключових рівнів.
Попередні максимуми й мінімуми, глибина книги ордерів та торгова активність можуть надати корисну інформацію.
Зняття ліквідності автоматично не підтверджує розворот. Варто звернути увагу на подальшу реакцію ціни.
🔹 3. Ціна й обсяг
Ціна показує рух ринку, а обсяг надає інформацію про участь у торгах.
Пробій ціни, що супроводжується збільшенням обсягу, може дати додатковий контекст, але не гарантує продовження руху.
🔹 4. Психологія ринку
Страх, жадібність, FOMO та надмірна самовпевненість можуть впливати на рішення.
Послідовний дослідницький підхід і розуміння власної толерантності до ризику можуть допомогти зменшити кількість рішень, зумовлених емоціями.
🔹 5. Три висновки, які варто запам’ятати
✅ Ніколи не оцінюйте рух цін лише за одним індикатором.
✅ Перш ніж інтерпретувати пробій, розберіться в ліквідності та структурі ринку.
✅ Зосередьтеся на дослідженні, усвідомленні ризиків і терпінні, а не на емоційних реакціях.
📌 Головний висновок тижня:
Структура ринку пояснює напрямок руху, ліквідність дає контекст, обсяг допомагає оцінити участь у торгах, а психологія впливає на рішення.
Розуміння того, як ці чинники взаємодіють, цінніше за спроби встигнути за кожним рухом ринку.
💬 Запитання: Яка тема цього тижня допомогла вам краще зрозуміти крипторинки?
Лише освітній контент. Не є фінансовою порадою.
#WeeklyCrypto #bitcoin #Marketstructure #CryptoEducatio

73

·
--
Стаття
Переглянути переклад
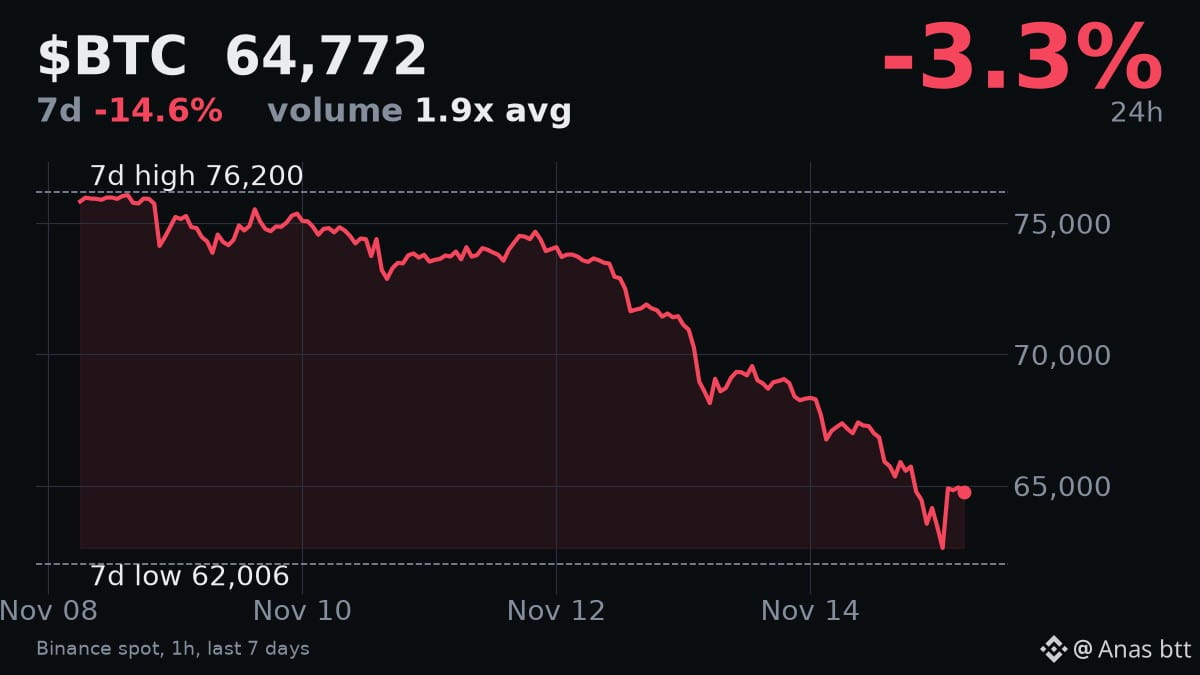
Weekly Market Review: Steep Declines and Extreme FearThe past week saw significant declines across the crypto market, with major assets experiencing sharp corrections. $BTC fell 14.585% and $ETH dropped 19.162% over the last seven days. This downturn has pushed market sentiment into "Extreme Fear," with the Fear & Greed Index now at 10.
Bitcoin Review
$BTC is currently trading at $64,771.53, down 3.297% in the last 24 hours. The weekly chart shows a notable decline of 14.585%. This move followed its 7-day high of $76,200.0, with the price now sitting almost 15% below that peak. The trading volume for $BTC in the last 24 hours was $2.48 billion USDT, which is 1.897 times its 7-day average volume. High volume on a downward move often confirms selling pressure.
My view on $BTC is bearish as long as it trades below the $70,000 level. The significant drop and sustained selling volume indicate that bears are in control. A clear break and sustained trading above $70,000 would be needed to reconsider a bullish stance. On the downside, the 7-day low of $62,006.0 is the immediate support to watch. A break below this level could lead to further declines.
Ethereum Review
$ETH is trading at $1,805.96, showing a 4.924% decrease over the past 24 hours. Over the last seven days, $ETH has seen a more pronounced decline of 19.162%. It touched a 7-day high of $2,246.0 and is now nearly 20% off that high. Volume for $ETH was $1.01 billion USDT in the last 24 hours, which is 1.729 times its 7-day average. Like $BTC, this elevated volume during a decline suggests conviction in the bearish move.
My view on $ETH is bearish, similar to $BTC. The sharp weekly drop and the current trading below $2,000 are clear bearish signals. For a shift in view, I would look for $ETH to reclaim and hold above the $2,000 mark with strong volume. The immediate support is the 7-day low of $1,711.08. Losing this level would confirm further downside potential.
Notable Movers
Among the top gainers, SOPH stood out with a 24-hour increase of 25.61%, reaching $0.00206 on a volume of $26.502 million USDT. This move comes amid a broad market downturn, suggesting specific positive sentiment or event for this asset.
On the losing side, KAVA experienced a significant drop, plummeting 56.237% in the last 24 hours to $0.02996. This was the steepest decline among the top assets, with $23.164 million USDT in trading volume. Other notable losers include ASTER, down 18.017%, and INJ, down 12.082%. Such large percentage drops indicate strong selling pressure or specific negative news for these assets.
Sentiment and Funding
The market sentiment, as measured by the Fear & Greed Index, has shifted firmly into "Extreme Fear." The index currently stands at 10, down from 13 yesterday. This rapid decrease reflects widespread apprehension among market participants following the recent price action. When the index is this low, it typically indicates that many traders are capitulating.
I note that the funding rates for $BTC and $ETH are currently not available in the provided data. However, the general sentiment indicates that any prior signs of crowded longs have likely been cleared out during this sharp correction.
What I am watching next week
For $BTC, I will be closely watching the $62,006.0 level. A sustained break below this point would signal further weakness and potentially target lower supports. On the upside, reclaiming $68,000 and holding it would be the first sign of a potential reversal, but a move above $70,000 is needed to shift my bearish view.
For $ETH, the key level to watch is the 7-day low of $1,711.08. A break below this would be a strong bearish continuation signal. To invalidate the current bearish view, $ETH would need to consolidate above $1,850 and then push towards $2,000 with strong buying volume. Until then, caution is warranted.
#WeeklyCrypto #MarketCorrection
Weekly Market Review: Steep Declines and Extreme Fear
The past week saw significant declines across the crypto market, with major assets experiencing sharp corrections. $BTC fell 14.585% and $ETH dropped 19.162% over the last seven days. This downturn has pushed market sentiment into "Extreme Fear," with the Fear & Greed Index now at 10.
Bitcoin Review
$BTC is currently trading at $64,771.53, down 3.297% in the last 24 hours. The weekly chart shows a notable decline of 14.585%. This move followed its 7-day high of $76,200.0, with the price now sitting almost 15% below that peak. The trading volume for $BTC in the last 24 hours was $2.48 billion USDT, which is 1.897 times its 7-day average volume. High volume on a downward move often confirms selling pressure.
My view on $BTC is bearish as long as it trades below the $70,000 level. The significant drop and sustained selling volume indicate that bears are in control. A clear break and sustained trading above $70,000 would be needed to reconsider a bullish stance. On the downside, the 7-day low of $62,006.0 is the immediate support to watch. A break below this level could lead to further declines.
Ethereum Review
$ETH is trading at $1,805.96, showing a 4.924% decrease over the past 24 hours. Over the last seven days, $ETH has seen a more pronounced decline of 19.162%. It touched a 7-day high of $2,246.0 and is now nearly 20% off that high. Volume for $ETH was $1.01 billion USDT in the last 24 hours, which is 1.729 times its 7-day average. Like $BTC , this elevated volume during a decline suggests conviction in the bearish move.
My view on $ETH is bearish, similar to $BTC . The sharp weekly drop and the current trading below $2,000 are clear bearish signals. For a shift in view, I would look for $ETH to reclaim and hold above the $2,000 mark with strong volume. The immediate support is the 7-day low of $1,711.08. Losing this level would confirm further downside potential.
Notable Movers
Among the top gainers, SOPH stood out with a 24-hour increase of 25.61%, reaching $0.00206 on a volume of $26.502 million USDT. This move comes amid a broad market downturn, suggesting specific positive sentiment or event for this asset.
On the losing side, KAVA experienced a significant drop, plummeting 56.237% in the last 24 hours to $0.02996. This was the steepest decline among the top assets, with $23.164 million USDT in trading volume. Other notable losers include ASTER, down 18.017%, and INJ, down 12.082%. Such large percentage drops indicate strong selling pressure or specific negative news for these assets.
Sentiment and Funding
The market sentiment, as measured by the Fear & Greed Index, has shifted firmly into "Extreme Fear." The index currently stands at 10, down from 13 yesterday. This rapid decrease reflects widespread apprehension among market participants following the recent price action. When the index is this low, it typically indicates that many traders are capitulating.
I note that the funding rates for $BTC and $ETH are currently not available in the provided data. However, the general sentiment indicates that any prior signs of crowded longs have likely been cleared out during this sharp correction.
What I am watching next week
For $BTC , I will be closely watching the $62,006.0 level. A sustained break below this point would signal further weakness and potentially target lower supports. On the upside, reclaiming $68,000 and holding it would be the first sign of a potential reversal, but a move above $70,000 is needed to shift my bearish view.
For $ETH , the key level to watch is the 7-day low of $1,711.08. A break below this would be a strong bearish continuation signal. To invalidate the current bearish view, $ETH would need to consolidate above $1,850 and then push towards $2,000 with strong buying volume. Until then, caution is warranted.
#WeeklyCrypto #MarketCorrection
Bitcoin Review
$BTC is currently trading at $64,771.53, down 3.297% in the last 24 hours. The weekly chart shows a notable decline of 14.585%. This move followed its 7-day high of $76,200.0, with the price now sitting almost 15% below that peak. The trading volume for $BTC in the last 24 hours was $2.48 billion USDT, which is 1.897 times its 7-day average volume. High volume on a downward move often confirms selling pressure.
My view on $BTC is bearish as long as it trades below the $70,000 level. The significant drop and sustained selling volume indicate that bears are in control. A clear break and sustained trading above $70,000 would be needed to reconsider a bullish stance. On the downside, the 7-day low of $62,006.0 is the immediate support to watch. A break below this level could lead to further declines.
Ethereum Review
$ETH is trading at $1,805.96, showing a 4.924% decrease over the past 24 hours. Over the last seven days, $ETH has seen a more pronounced decline of 19.162%. It touched a 7-day high of $2,246.0 and is now nearly 20% off that high. Volume for $ETH was $1.01 billion USDT in the last 24 hours, which is 1.729 times its 7-day average. Like $BTC , this elevated volume during a decline suggests conviction in the bearish move.
My view on $ETH is bearish, similar to $BTC . The sharp weekly drop and the current trading below $2,000 are clear bearish signals. For a shift in view, I would look for $ETH to reclaim and hold above the $2,000 mark with strong volume. The immediate support is the 7-day low of $1,711.08. Losing this level would confirm further downside potential.
Notable Movers
Among the top gainers, SOPH stood out with a 24-hour increase of 25.61%, reaching $0.00206 on a volume of $26.502 million USDT. This move comes amid a broad market downturn, suggesting specific positive sentiment or event for this asset.
On the losing side, KAVA experienced a significant drop, plummeting 56.237% in the last 24 hours to $0.02996. This was the steepest decline among the top assets, with $23.164 million USDT in trading volume. Other notable losers include ASTER, down 18.017%, and INJ, down 12.082%. Such large percentage drops indicate strong selling pressure or specific negative news for these assets.
Sentiment and Funding
The market sentiment, as measured by the Fear & Greed Index, has shifted firmly into "Extreme Fear." The index currently stands at 10, down from 13 yesterday. This rapid decrease reflects widespread apprehension among market participants following the recent price action. When the index is this low, it typically indicates that many traders are capitulating.
I note that the funding rates for $BTC and $ETH are currently not available in the provided data. However, the general sentiment indicates that any prior signs of crowded longs have likely been cleared out during this sharp correction.
What I am watching next week
For $BTC , I will be closely watching the $62,006.0 level. A sustained break below this point would signal further weakness and potentially target lower supports. On the upside, reclaiming $68,000 and holding it would be the first sign of a potential reversal, but a move above $70,000 is needed to shift my bearish view.
For $ETH , the key level to watch is the 7-day low of $1,711.08. A break below this would be a strong bearish continuation signal. To invalidate the current bearish view, $ETH would need to consolidate above $1,850 and then push towards $2,000 with strong buying volume. Until then, caution is warranted.
#WeeklyCrypto #MarketCorrection
80

·
--
Оптимістично
🚨 $LAB ІНВЕСТОРИ У КРИПТОВАЛЮТІ ВИХОДЯТЬ НА МАРЖУ!
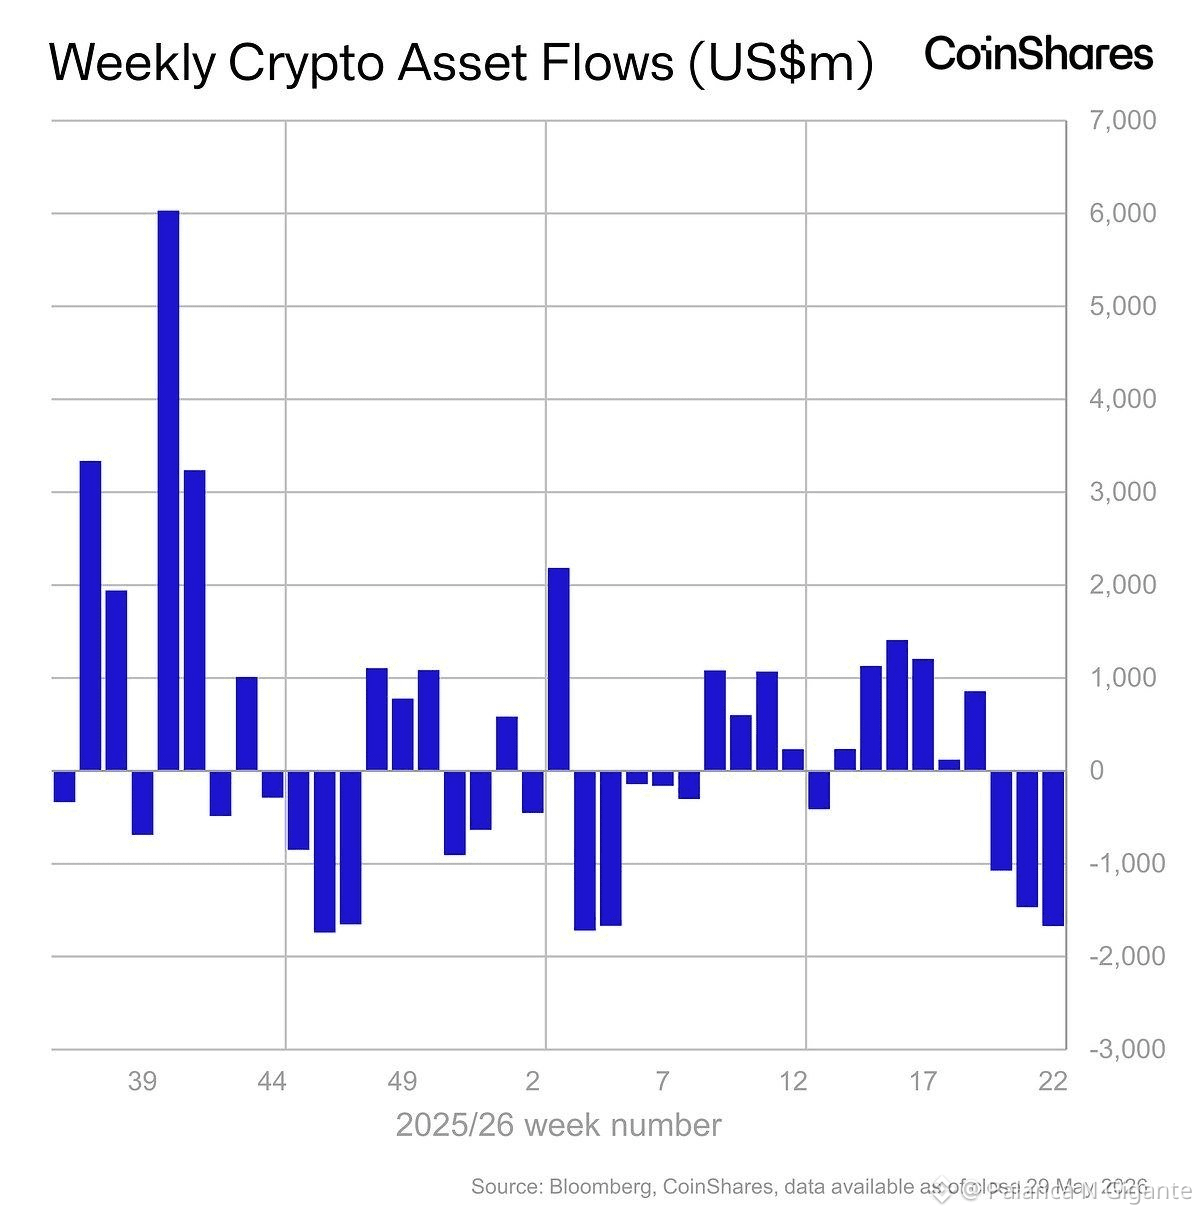
$EPIC Продукти інвестування в цифрові активи зафіксували 1,67 МІЛЬЯРДА доларів виведень на минулому тижні, що стало вже третім тижнем підряд з виведеннями та другим найбільшим тижневим виведенням у 2026 році. $H 📉🔥
{future}(HUSDT)
{future}(LABUSDT)
{spot}(EPICUSDT)
#WeeklyCrypto #JapanCryptoETFYenStablecoin #ISMManufacturingPricesMiss #bullish #usd
🚨 $LAB ІНВЕСТОРИ У КРИПТОВАЛЮТІ ВИХОДЯТЬ НА МАРЖУ!
$EPIC Продукти інвестування в цифрові активи зафіксували 1,67 МІЛЬЯРДА доларів виведень на минулому тижні, що стало вже третім тижнем підряд з виведеннями та другим найбільшим тижневим виведенням у 2026 році. $H 📉🔥
#WeeklyCrypto #JapanCryptoETFYenStablecoin #ISMManufacturingPricesMiss #bullish #usd
$EPIC Продукти інвестування в цифрові активи зафіксували 1,67 МІЛЬЯРДА доларів виведень на минулому тижні, що стало вже третім тижнем підряд з виведеннями та другим найбільшим тижневим виведенням у 2026 році. $H 📉🔥
#WeeklyCrypto #JapanCryptoETFYenStablecoin #ISMManufacturingPricesMiss #bullish #usd
2
1
753

☕ У неділю добре час відволіктися від шуму й подивитися на картину ширше.
Цього тижня я переглядаю:
📈 $BTC тренд
Ξ $ETH продуктивність
🟡 $BNB рух
📊 Загальні настрої на ринку
🌎 Важливі макроекономічні події
Мета — не передбачити кожен рух. Мета — зрозуміти, що змінилося, і підготуватися до наступного тижня.
Яка найважливіша подія в криптовалюті, за якою ти стежив(ла) цього вихідного?
#WeeklyCrypto to #Bitcoin #BinanceSquare #Crypto
☕ У неділю добре час відволіктися від шуму й подивитися на картину ширше.
Цього тижня я переглядаю:
📈 $BTC тренд
Ξ $ETH продуктивність
🟡 $BNB рух
📊 Загальні настрої на ринку
🌎 Важливі макроекономічні події
Мета — не передбачити кожен рух. Мета — зрозуміти, що змінилося, і підготуватися до наступного тижня.
Яка найважливіша подія в криптовалюті, за якою ти стежив(ла) цього вихідного?
#WeeklyCrypto to #Bitcoin #BinanceSquare #Crypto
Цього тижня я переглядаю:
📈 $BTC тренд
Ξ $ETH продуктивність
🟡 $BNB рух
📊 Загальні настрої на ринку
🌎 Важливі макроекономічні події
Мета — не передбачити кожен рух. Мета — зрозуміти, що змінилося, і підготуватися до наступного тижня.
Яка найважливіша подія в криптовалюті, за якою ти стежив(ла) цього вихідного?
#WeeklyCrypto to #Bitcoin #BinanceSquare #Crypto
82
Увійдіть, щоб переглянути інший контент
Приєднуйтесь до користувачів криптовалют по всьому світу на Binance Square
⚡️ Отримуйте актуальну та корисну інформацію про криптовалюти.
💬 Приєднуйтесь до найбільшої у світі криптобіржі.
👍 Відкрийте справжні ідеї від перевірених авторів.
Електронна пошта / номер телефону
Трендові теми
1
#fomcвідстеження
121,867 переглядів
541 обговорюють
2
#A Packed Week of Earnings and Data Tests Markets
3,906 переглядів
86 обговорюють
3
#AnthropicIPOTestsInvestorAppetiteForAI
1,407 переглядів
60 обговорюють
4
#HuangReportedlyConsidersReturnToNvidia
19,183 переглядів
298 обговорюють
5
#CryptoSelloffTriggersMultipleWhaleLiquidations
280,760 переглядів
2,342 обговорюють
6
#BitcoinSpotETFsPost$1.065BOutflowsForThirdStraightWeek
1,525 переглядів
42 обговорюють
7
#About64000BitcoinMiningMachinesReportedlyHijacked
17,031 переглядів
222 обговорюють
8
#USSpotXRPETFsSeeLargestWeeklyOutflowIn8Months
223,852 переглядів
1,839 обговорюють
9
#WillFOMCMinutesReinforceRateHikeExpectations?
84,636 переглядів
937 обговорюють
10
#BitcoinActiveSupplyInProfitDropsBelow45%
297,154 переглядів
2,065 обговорюють