

Aaliyah Shiddiqah
226 Following
21 Followers
4 Liked
Posts
All
Quotes


Bluechip
·
--
Article 4 Memecoins series: how to avoid SCAM and buy only GEMS
99% traders lose EVERYTHING on memecoins
The reason? They don't know those simple rules
I spent 2 years mastering memecoins trading
Others would charge for this, but not me
Here’s how to avoid SCAM and buy only GEMS
1/ Memecoins = pure narrative
Unlike tech tokens, memes move on culture, virality, and community
The trick isn’t finding “utility” but spotting hype early
If you master filters + tools, you’ll win while others get rugged
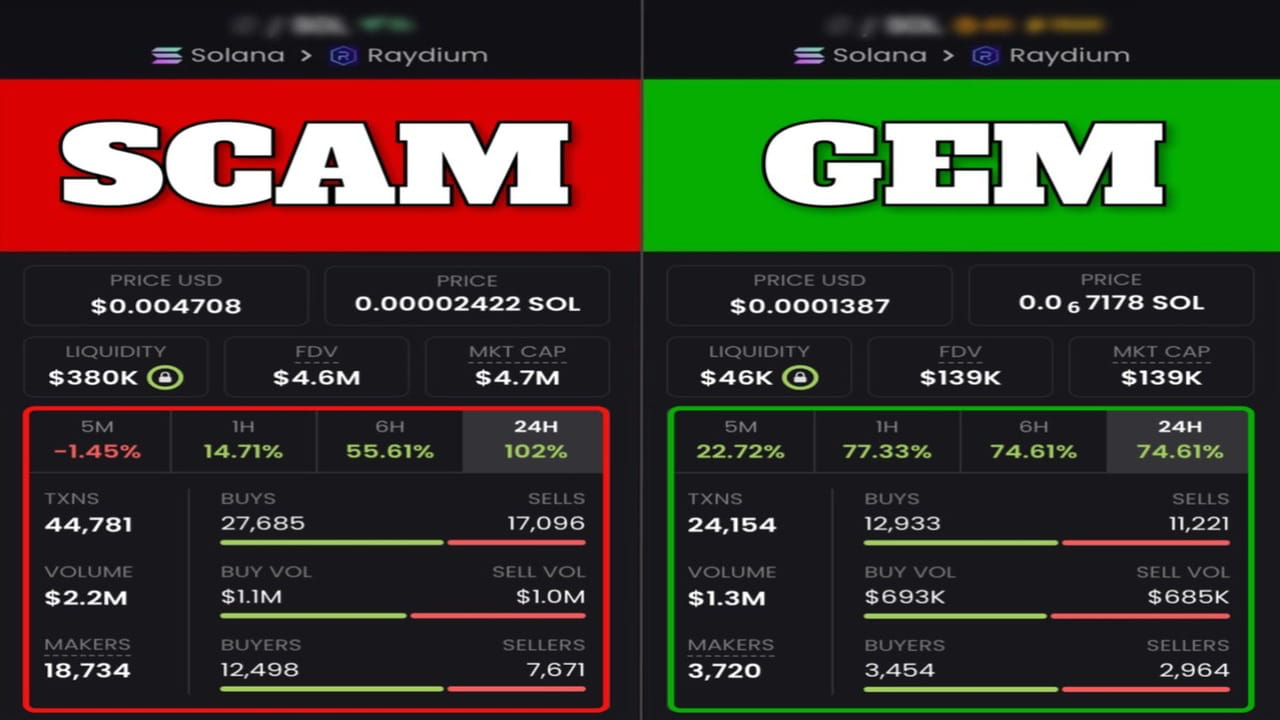
2/ Rule #1: Liquidity
Every scam coin dies because of bad liquidity
Check if liquidity is locked - no lock means devs can pull it anytime
Use RugCheck or Dexscreener tags before buying
3/ Rule #2: BubbleMaps
BubbleMaps shows how tokens are distributed
If one wallet holds 30-50% of supply, that’s a red flag
Healthy projects spread tokens across many wallets = less dump risk
4/ Rule #3: Social pulse
Memecoins live on Twitter, TG, and Discord
If the hype is organic (memes, viral engagement, influencer push) it’s bullish
If it’s only bots + shillers, it’s trash
5/ RugCheck is your best friend
This website lets you scan a token contract in seconds
It shows if the token is honeypot, if supply is renounced, and if LP is locked
Use it EVERY time before you ape
6/ Volume matters
Low volume = low liquidity = dead coin
Focus on memecoins with consistent $1M+ daily volume
Big volume attracts traders, and traders pump your bags
7/ Memes > Whitepapers
People buy for laughs, culture, and identity
If you’re reading a 20-page whitepaper for a meme coin, you’re doing it wrong
Strong branding + viral energy beats “utility” every time
8/ Ride sectors, not coins
Memecoins pump in sectors (dogs, cats, frogs, politics, AI)
If you spot the next hot sector early, almost every coin in it pumps
Rotation is how you turn 2x plays into 20x
9/ Protect your wins
Rotate profits into stables or majors like $ETH / $SOL
Don’t round-trip gains - the market punishes greed
One 50x win is better than holding 10 rugs
10/ Why this matters
Memecoins aren’t just fun
They’re the most profitable corner of crypto this cycle, and they’ll onboard millions
The difference between winning and losing is your ability to filter scams
11/ Summary
Memecoins = hype + virality
Your edge = liquidity checks, BubbleMaps, RugCheck, and volume filters
Learn to rotate + secure profits
Do this right and you’ll catch the next Doge-level explosion
📌 Follow @Bluechip for unfiltered crypto intelligence, feel free to bookmark & share.
The reason? They don't know those simple rules
I spent 2 years mastering memecoins trading
Others would charge for this, but not me
Here’s how to avoid SCAM and buy only GEMS
1/ Memecoins = pure narrative
Unlike tech tokens, memes move on culture, virality, and community
The trick isn’t finding “utility” but spotting hype early
If you master filters + tools, you’ll win while others get rugged
2/ Rule #1: Liquidity
Every scam coin dies because of bad liquidity
Check if liquidity is locked - no lock means devs can pull it anytime
Use RugCheck or Dexscreener tags before buying
3/ Rule #2: BubbleMaps
BubbleMaps shows how tokens are distributed
If one wallet holds 30-50% of supply, that’s a red flag
Healthy projects spread tokens across many wallets = less dump risk
4/ Rule #3: Social pulse
Memecoins live on Twitter, TG, and Discord
If the hype is organic (memes, viral engagement, influencer push) it’s bullish
If it’s only bots + shillers, it’s trash
5/ RugCheck is your best friend
This website lets you scan a token contract in seconds
It shows if the token is honeypot, if supply is renounced, and if LP is locked
Use it EVERY time before you ape
6/ Volume matters
Low volume = low liquidity = dead coin
Focus on memecoins with consistent $1M+ daily volume
Big volume attracts traders, and traders pump your bags
7/ Memes > Whitepapers
People buy for laughs, culture, and identity
If you’re reading a 20-page whitepaper for a meme coin, you’re doing it wrong
Strong branding + viral energy beats “utility” every time
8/ Ride sectors, not coins
Memecoins pump in sectors (dogs, cats, frogs, politics, AI)
If you spot the next hot sector early, almost every coin in it pumps
Rotation is how you turn 2x plays into 20x
9/ Protect your wins
Rotate profits into stables or majors like $ETH / $SOL
Don’t round-trip gains - the market punishes greed
One 50x win is better than holding 10 rugs
10/ Why this matters
Memecoins aren’t just fun
They’re the most profitable corner of crypto this cycle, and they’ll onboard millions
The difference between winning and losing is your ability to filter scams
11/ Summary
Memecoins = hype + virality
Your edge = liquidity checks, BubbleMaps, RugCheck, and volume filters
Learn to rotate + secure profits
Do this right and you’ll catch the next Doge-level explosion
📌 Follow @Bluechip for unfiltered crypto intelligence, feel free to bookmark & share.
Quoted content has been removed

Ardizor
·
--
The biggest Altseason will start today! 🔥
The biggest Altseason will start today! 🔥
Many alts from $SOL ecosystems will go parabolic soon
Your $450 invested today = $31,000 next year
All you need to do is buy the right tokens.
Here are my top 4 picks with 10 - 100x potential 👇🧵
‼️‼️‼️
$SOL reached a new ATH. The Solana ecosystem is expected to show a strong bullish trend soon.
➢ Our goal now is to find tokens with a market cap under $1 billion—or ideally, under $200-300 million—for the potential of higher profits.
To boost the chances of big profits, we need to keep an eye on the leading narratives.
➢ For example: AI, RWA, DePIN, MEME, and so on.
➢ Here’s a visual of the $SOL ecosystem:
Also, a couple of days ago, the Bitwise filing for the Solana ETF.
➢ Already 3 major funds have filed for the ETF: VanEck, Canary Capital, and Bitwise.
➢ Next will be BlackRock.
➢ When $SOL gets ETF approval, expect Solana and its ecosystem to grow.
1/ $IO
@ionet the world's largest decentralized AI network, giving machine learning engineers scalable, distributed clusters at a fraction of the cost.
➢ Sector: AI, DePIN
➢ Price 2.7
➢ Market Cap: $327M
➢ Backed by: Multicoin, Delphi Digital
➢ $SOL CA: BZLbGTNCSFfoth2GYDtwr7e4imWzpR5jqcUuGEwr646K
2/ $GRASS
@getgrass_io the flagship product of Wynd Network, revolutionizes internet connectivity by enabling users to monetize their unused network resources.
➢ Sector: AI, DePIN
➢ Price: $2.2
➢ Market Cap: $544M
➢ Backed by: Polychain Capital, Delphi Venture, HACK VC
➢ $SOL CA: Grass7B4RdKfBCjTKgSqnXkqjwiGvQyFbuSCUJr3XXjs
3/ $ZEUS
@ZeusNetworkHQ is a pioneering permissionless layer that integrates the robust capabilities of Solana and Bitcoin.
➢ Sector: L2 (SVM)
➢ Price: $0.45
➢ Market Cap: $73M
➢ Backed by: The Spartan Group, OKX
➢ $SOL CA: ZEUS1aR7aX8DFFJf5QjWj2ftDDdNTroMNGo8YoQm3Gq
4/ $DRIFT
@DriftProtocol brings on-chain, cross-margined perpetual futures to Solana.
➢ Sector: Defi, Perpetual
➢ Price: $1.38
➢ Market Cap: $365M
➢ Backed by: Polychain, Multicoin
➢ $SOL CA: DriFtupJYLTosbwoN8koMbEYSx54aFAVLddWsbksjwg7
Many alts from $SOL ecosystems will go parabolic soon
Your $450 invested today = $31,000 next year
All you need to do is buy the right tokens.
Here are my top 4 picks with 10 - 100x potential 👇🧵
‼️‼️‼️
$SOL reached a new ATH. The Solana ecosystem is expected to show a strong bullish trend soon.
➢ Our goal now is to find tokens with a market cap under $1 billion—or ideally, under $200-300 million—for the potential of higher profits.
To boost the chances of big profits, we need to keep an eye on the leading narratives.
➢ For example: AI, RWA, DePIN, MEME, and so on.
➢ Here’s a visual of the $SOL ecosystem:
Also, a couple of days ago, the Bitwise filing for the Solana ETF.
➢ Already 3 major funds have filed for the ETF: VanEck, Canary Capital, and Bitwise.
➢ Next will be BlackRock.
➢ When $SOL gets ETF approval, expect Solana and its ecosystem to grow.
1/ $IO
@ionet the world's largest decentralized AI network, giving machine learning engineers scalable, distributed clusters at a fraction of the cost.
➢ Sector: AI, DePIN
➢ Price 2.7
➢ Market Cap: $327M
➢ Backed by: Multicoin, Delphi Digital
➢ $SOL CA: BZLbGTNCSFfoth2GYDtwr7e4imWzpR5jqcUuGEwr646K
2/ $GRASS
@getgrass_io the flagship product of Wynd Network, revolutionizes internet connectivity by enabling users to monetize their unused network resources.
➢ Sector: AI, DePIN
➢ Price: $2.2
➢ Market Cap: $544M
➢ Backed by: Polychain Capital, Delphi Venture, HACK VC
➢ $SOL CA: Grass7B4RdKfBCjTKgSqnXkqjwiGvQyFbuSCUJr3XXjs
3/ $ZEUS
@ZeusNetworkHQ is a pioneering permissionless layer that integrates the robust capabilities of Solana and Bitcoin.
➢ Sector: L2 (SVM)
➢ Price: $0.45
➢ Market Cap: $73M
➢ Backed by: The Spartan Group, OKX
➢ $SOL CA: ZEUS1aR7aX8DFFJf5QjWj2ftDDdNTroMNGo8YoQm3Gq
4/ $DRIFT
@DriftProtocol brings on-chain, cross-margined perpetual futures to Solana.
➢ Sector: Defi, Perpetual
➢ Price: $1.38
➢ Market Cap: $365M
➢ Backed by: Polychain, Multicoin
➢ $SOL CA: DriFtupJYLTosbwoN8koMbEYSx54aFAVLddWsbksjwg7

Flux Bro
·
--
When to Sell in Crypto: A Bulletproof Guide 🚀💰
Understand Bitcoin Dominance (BTC.D):📈 If BTC.D is increasing: Money is flowing into Bitcoin; altcoins may bleed. Stay cautious with alts.📉 If BTC.D is decreasing: Capital is rotating into altcoins — this could signal the start of Altseason.Key Signals to Sell Bitcoin (BTC):⚡ BTC hits significant psychological levels (e.g., $100K or beyond).🚨 Retail euphoria kicks in (e.g., media headlines, random people hyping BTC).📊 Indicators like RSI/MACD show extreme overbought signals.🛑 Pi Cycle Top Indicator flashes a sell signal (historically accurate).Altcoins Selling Strategy:⏳ Sell early into parabolic moves; don’t wait for the absolute top.🎯 Sell in targets or tiers (e.g., 25%, 50%, 75%) — no one catches the top perfectly.💸 Rotate profits into stablecoins ($USDT, $USDC) or BTC for safer positions.Market Sentiment to Watch for a Top:📱 Coinbase reaches #1 on app stores.🗞️ Crypto dominates mainstream media headlines.🎥 TikTok influencers and random friends start trading meme coins.💬 Grocery store or gym conversations become crypto-centric.Technical Indicators to Use:🚨 Bearish Divergences: Price is increasing, but RSI/MACD shows declining momentum.📉 Lower Highs & Lower Lows: Clear sign of a trend reversal.🕯️ Engulfing Red Candles: Sudden sell-offs indicate distribution.🔥 Declining volume during price rises = weak momentum.Bitcoin → Altcoins Rotation Timing:⌛ BTC new ATH? Wait 4–6 weeks for Ethereum ($ETH) to follow.🪙 After ETH pumps, Large Caps like $SOL, $ADA, and $MATIC will rally.🚀 Final parabolic phase: Mid Caps, then Small Caps, then Micro Caps pump massively.Practical Selling Tips:💼 Always secure initial investment first (take out your principal).🔔 Set sell alerts or ladder limit orders ahead of key levels.❌ Don’t get greedy — "10x profits can vanish in hours during corrections."🛡️ Diversify profits into low-risk assets like real estate, gold, or stocks.Signs of the Final Market Top:🚀 Altcoins randomly 20x–50x in days.🤑 Everyone’s making money, and “Crypto Millionaire” stories flood the internet.💰 Institutions and whales quietly start dumping on retail buyers.Mindset is Key:🧠 “Profit is profit” — never regret taking gains too early.🕰️ Market cycles repeat — there’s always another chance in the next cycle.🔒 Play defense as much as offense; securing wealth > chasing tops.Final Note:
Don’t panic, don’t FOMO, and always stick to your plan.The market rewards discipline, not emotions.
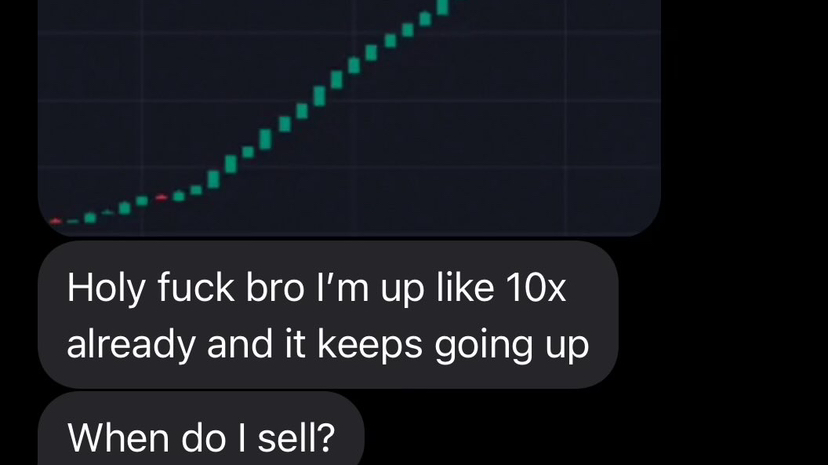
Plan your exit before the hype consumes you. 🛑 Timing is everything.
Don’t panic, don’t FOMO, and always stick to your plan.The market rewards discipline, not emotions.
Plan your exit before the hype consumes you. 🛑 Timing is everything.

Samina Khan
·
--
➢ HOW I TRANSFORMED $100 INTO $5,000 WITH CANDLESTICK PATTERNS! 💸
Trading can feel overwhelming, especially when you’re starting with a small amount. But guess what? I turned my $100 into a whopping $5,000 just by mastering candlestick patterns. Want to know how? Here’s the journey that flipped my financial world upside down! 😎✨
👉 Follow for daily signals and stay ahead in the trading game!
Understanding Candlestick Patterns
Candlestick patterns are the real pulse of market movements. Each candle reveals a story—the open, close, high, and low within a specific timeframe. Once you master these patterns, predicting market moves becomes second nature! 💡📈
Essential Patterns You Need to Know
Doji: Represents market indecision and hints at potential reversals.
Hammer: Appears after a downtrend and signals a possible upward reversal. 🛠️
Engulfing Patterns: Bullish suggests an upward trend; bearish points to a downward shift. 📉➡️📈
🔥 My Strategy That Turned the Tables 🔥
1. Learn & Practice 📚
I didn’t jump in blindly. I invested time in understanding candlestick patterns, following experts, and practicing with paper trading until I felt confident.
2. Picking the Right Trading Platform 📱
I chose a platform that was easy to use, offered low fees, and had a demo account to test my strategies risk-free.
3. Identifying the Right Opportunities 🔍
Focusing on highly volatile stocks and forex pairs, I watched for key candlestick patterns during peak trading hours, spotting the most profitable setups.
4. Starting Small & Growing Big 🌱
With just $100, I traded low-cost stocks or fractional shares based on clear patterns, keeping my risk in check.
5. Mastering Risk Management 🛡️
I always used stop-loss orders to protect my capital, ensuring no single trade could wipe me out.
Scaling Up – The Game-Changer! 🚀
1. Reinvesting Profits 💼
Every profit went back into trading, allowing me to take larger positions and seize bigger opportunities.
2. Staying Disciplined 💪
I kept emotions out of it, avoided overtrading, and regularly reviewed my trades to keep refining my strategy.
3. Diversifying Smartly 🌐
I spread my investments across different assets, which helped cushion against market swings and reduced risk.
✨ The Breakthrough Moment ✨
One day, I identified a powerful bullish engulfing pattern in a tech stock. I took the leap and invested a larger sum. That stock surged, and this bold move pushed my $100 investment towards the $5,000 mark! 💥💰
Final Thoughts
Turning $100 into $5,000 with candlestick patterns didn’t happen overnight. It took dedication, learning, and a solid strategy. But if you commit to mastering these patterns, you can absolutely achieve similar success! Remember, it’s a long game, but it’s worth every step. 🌟💡
💥 Success isn’t a sprint; it’s a marathon. Start your trading journey today, and who knows—you could be the next big success story! 💥
Now let's talk about @DODO
➢ DODO IS ABOUT TO REVOLUTIONIZE DEFI! 🚀 #DODOEmpowersMemeIssuance
Heads up, everyone! DODO is shaking up the DeFi world, and if you haven’t tuned in yet, here’s why you should. DODO's got this cutting-edge Proactive Market Maker (PMM) algorithm that ensures smooth trading, less risk of impermanent loss, and way better prices for traders. And get this—one-click token creation is a reality! That means you can launch your own tokens without any coding skills. It’s truly that simple.
Now for the real buzz: Meme coins are all the rage, and DODO is about to launch a Meme platform that’s set to draw in tons of new users. With multi-chain support and absolutely no entry barriers, it’s going to be the next big thing!
But wait, there’s more! DODO offers self-initiated mining (yes, you can create your own mining campaigns!) and the Pegged Pool, designed to manage BTCFi assets and Meme coins. These features are complete game-changers for ensuring liquidity and stability.
Backed by big players like Binance Labs and still with a low market cap, DODO is gearing up for an explosive market run. This is a project you’ll definitely want to keep an eye on!
What’s your take? Is DODO set to lead the next DeFi and Meme coin revolution? Let’s explore it together! 💥
🔔 Like, share, and follow for more trading insights and tips! 🙌
👉 Follow for daily signals and stay ahead in the trading game!
Understanding Candlestick Patterns
Candlestick patterns are the real pulse of market movements. Each candle reveals a story—the open, close, high, and low within a specific timeframe. Once you master these patterns, predicting market moves becomes second nature! 💡📈
Essential Patterns You Need to Know
Doji: Represents market indecision and hints at potential reversals.
Hammer: Appears after a downtrend and signals a possible upward reversal. 🛠️
Engulfing Patterns: Bullish suggests an upward trend; bearish points to a downward shift. 📉➡️📈
🔥 My Strategy That Turned the Tables 🔥
1. Learn & Practice 📚
I didn’t jump in blindly. I invested time in understanding candlestick patterns, following experts, and practicing with paper trading until I felt confident.
2. Picking the Right Trading Platform 📱
I chose a platform that was easy to use, offered low fees, and had a demo account to test my strategies risk-free.
3. Identifying the Right Opportunities 🔍
Focusing on highly volatile stocks and forex pairs, I watched for key candlestick patterns during peak trading hours, spotting the most profitable setups.
4. Starting Small & Growing Big 🌱
With just $100, I traded low-cost stocks or fractional shares based on clear patterns, keeping my risk in check.
5. Mastering Risk Management 🛡️
I always used stop-loss orders to protect my capital, ensuring no single trade could wipe me out.
Scaling Up – The Game-Changer! 🚀
1. Reinvesting Profits 💼
Every profit went back into trading, allowing me to take larger positions and seize bigger opportunities.
2. Staying Disciplined 💪
I kept emotions out of it, avoided overtrading, and regularly reviewed my trades to keep refining my strategy.
3. Diversifying Smartly 🌐
I spread my investments across different assets, which helped cushion against market swings and reduced risk.
✨ The Breakthrough Moment ✨
One day, I identified a powerful bullish engulfing pattern in a tech stock. I took the leap and invested a larger sum. That stock surged, and this bold move pushed my $100 investment towards the $5,000 mark! 💥💰
Final Thoughts
Turning $100 into $5,000 with candlestick patterns didn’t happen overnight. It took dedication, learning, and a solid strategy. But if you commit to mastering these patterns, you can absolutely achieve similar success! Remember, it’s a long game, but it’s worth every step. 🌟💡
💥 Success isn’t a sprint; it’s a marathon. Start your trading journey today, and who knows—you could be the next big success story! 💥
Now let's talk about @DODO
➢ DODO IS ABOUT TO REVOLUTIONIZE DEFI! 🚀 #DODOEmpowersMemeIssuance
Heads up, everyone! DODO is shaking up the DeFi world, and if you haven’t tuned in yet, here’s why you should. DODO's got this cutting-edge Proactive Market Maker (PMM) algorithm that ensures smooth trading, less risk of impermanent loss, and way better prices for traders. And get this—one-click token creation is a reality! That means you can launch your own tokens without any coding skills. It’s truly that simple.
Now for the real buzz: Meme coins are all the rage, and DODO is about to launch a Meme platform that’s set to draw in tons of new users. With multi-chain support and absolutely no entry barriers, it’s going to be the next big thing!
But wait, there’s more! DODO offers self-initiated mining (yes, you can create your own mining campaigns!) and the Pegged Pool, designed to manage BTCFi assets and Meme coins. These features are complete game-changers for ensuring liquidity and stability.
Backed by big players like Binance Labs and still with a low market cap, DODO is gearing up for an explosive market run. This is a project you’ll definitely want to keep an eye on!
What’s your take? Is DODO set to lead the next DeFi and Meme coin revolution? Let’s explore it together! 💥
🔔 Like, share, and follow for more trading insights and tips! 🙌


CryptoGuru12
·
--
How To Sell Your $HMSTR Tokens with High Value
Selling your $HMSTR tokens at a high value can be quite the game if you know when and how to time your trades. Let’s be real—just like any other cryptocurrency, the price of $HMSTR can fluctuate quickly. However, by following some simple steps and strategies, you can maximize your returns and avoid costly mistakes that many traders fall into. Here’s a breakdown of how to sell your $HMSTR tokens for the highest possible value.
First off, don’t rush to sell as soon as the trade starts. Often, when trading begins, the price of a token may fluctuate, and this can lead to hasty decisions. It's common to see a quick spike in value once the token gets listed or when interest begins to build. The key here is patience. Watch how the value evolves over the first few hours. Instead of panic-selling when the price starts dipping slightly, wait for that upward momentum.
Next, don't hold on for too long, either. Yes, the value of $HMSTR may rise, but holding onto the tokens forever could mean missing the right window to sell. You don’t want to be in the position of those who wait endlessly, thinking the price will keep going up, only for it to plummet instead. Timing is everything in crypto. Make sure you’ve set a realistic price target—this is crucial. If you’re too greedy, you could lose a golden opportunity and end up selling at a much lower price than expected.
Another important factor is to avoid setting a long minting period. Some traders fall into the trap of holding onto tokens without a clear exit strategy. While it might be tempting to wait for massive gains, setting your mint too long can backfire. You may see the price crash before you get the chance to cash out, leading to losses. Remember, just like in life, crypto moves fast, and the market can change in an instant.
Finally, don’t get caught up in 'dog-like' trading habits. This is a common pitfall, where traders follow the herd blindly without their own strategy in place. Just because others are rushing to buy or sell doesn’t mean you should do the same. Rely on your own research and intuition, not just the hype. Make calculated decisions based on market trends, and be prepared to stick to your plan—even if the crowd is panicking.
In summary, selling your $HMSTR tokens successfully requires a mix of patience, quick action when necessary, and a solid strategy. Keep your eyes on the market, be realistic about your targets, and don’t let greed or fear dictate your moves. Follow these steps, and you’ll increase your chances of walking away with some solid gains.
First off, don’t rush to sell as soon as the trade starts. Often, when trading begins, the price of a token may fluctuate, and this can lead to hasty decisions. It's common to see a quick spike in value once the token gets listed or when interest begins to build. The key here is patience. Watch how the value evolves over the first few hours. Instead of panic-selling when the price starts dipping slightly, wait for that upward momentum.
Next, don't hold on for too long, either. Yes, the value of $HMSTR may rise, but holding onto the tokens forever could mean missing the right window to sell. You don’t want to be in the position of those who wait endlessly, thinking the price will keep going up, only for it to plummet instead. Timing is everything in crypto. Make sure you’ve set a realistic price target—this is crucial. If you’re too greedy, you could lose a golden opportunity and end up selling at a much lower price than expected.
Another important factor is to avoid setting a long minting period. Some traders fall into the trap of holding onto tokens without a clear exit strategy. While it might be tempting to wait for massive gains, setting your mint too long can backfire. You may see the price crash before you get the chance to cash out, leading to losses. Remember, just like in life, crypto moves fast, and the market can change in an instant.
Finally, don’t get caught up in 'dog-like' trading habits. This is a common pitfall, where traders follow the herd blindly without their own strategy in place. Just because others are rushing to buy or sell doesn’t mean you should do the same. Rely on your own research and intuition, not just the hype. Make calculated decisions based on market trends, and be prepared to stick to your plan—even if the crowd is panicking.
In summary, selling your $HMSTR tokens successfully requires a mix of patience, quick action when necessary, and a solid strategy. Keep your eyes on the market, be realistic about your targets, and don’t let greed or fear dictate your moves. Follow these steps, and you’ll increase your chances of walking away with some solid gains.


BullishBanter
·
--
Why Do We Lose Money in Crypto? 🚨‼️ Believe it or not, most of your losses are the result of whale games! But here’s the deal: you can beat them at their own game and come out on top. Whales manipulate the market and pocket millions during each pump and dump. However, with the right approach, you can steer clear of their traps and aim for profits that exceed $100k. Here’s how I’ve navigated these murky waters:
Whale Tactics Exposed:
1. Accumulation ➱ Pump: Whales quietly accumulate coins and then drive prices up for big gains.
2. Re-Accumulation ➱ Pump: They come back to buy more after an initial peak, pushing prices even higher.
3. Distribution ➱ Dump: Once prices are sky-high, they sell their holdings to cash in.
4. Re-Distribution ➱ Dump: Another sell-off follows as they offload more coins.
5. Price Manipulation: Whales love playing long-term games, tricking regular traders into losses.
They push prices down, triggering panic sales from smaller traders, then swoop in for cheap buys. Watch for patterns where prices repeatedly test resistance and support levels, as this can signal whale activity.
Look Out For These Signals:
Quick Breakouts Followed by Drops: A sudden spike followed by a fast fall is often a sign of manipulation.
Fair Value Gaps (FVG): During volatile periods, price gaps can appear, often followed by retracements—stay alert for these moments.
False Patterns & Retail Traps: Whales love creating fake signals to mislead traders. Large buy/sell orders are often used to confuse retail traders—don’t get fooled!
With awareness and strategy, you can stay one step ahead of the whales and secure consistent wins!
#LoserAndGainer #Loss #BinanceLaunchpoolHMSTR #BTCReboundsAfterFOMC #TrumpFirstBTCUse
Whale Tactics Exposed:
1. Accumulation ➱ Pump: Whales quietly accumulate coins and then drive prices up for big gains.
2. Re-Accumulation ➱ Pump: They come back to buy more after an initial peak, pushing prices even higher.
3. Distribution ➱ Dump: Once prices are sky-high, they sell their holdings to cash in.
4. Re-Distribution ➱ Dump: Another sell-off follows as they offload more coins.
5. Price Manipulation: Whales love playing long-term games, tricking regular traders into losses.
They push prices down, triggering panic sales from smaller traders, then swoop in for cheap buys. Watch for patterns where prices repeatedly test resistance and support levels, as this can signal whale activity.
Look Out For These Signals:
Quick Breakouts Followed by Drops: A sudden spike followed by a fast fall is often a sign of manipulation.
Fair Value Gaps (FVG): During volatile periods, price gaps can appear, often followed by retracements—stay alert for these moments.
False Patterns & Retail Traps: Whales love creating fake signals to mislead traders. Large buy/sell orders are often used to confuse retail traders—don’t get fooled!
With awareness and strategy, you can stay one step ahead of the whales and secure consistent wins!
#LoserAndGainer #Loss #BinanceLaunchpoolHMSTR #BTCReboundsAfterFOMC #TrumpFirstBTCUse

CRYPTO MECHANIC
·
--
Every day, we compete with each other.
One trader's TP is another trader's Stop Loss.
So, who wins at the end?
The Focused, Calm, Emotionally-Intelligent trader will always take the money of the
FOMO, Emotional and Unfocused trader.
So - what can be done to ensure you win?Trading is about Focus
Time = Energy Wasted .
Energy Wasted = Loss of Focus and Edge.
The more time you spend on charts, the more energy you waste, the smaller your edge becomes. It's Counterintuitive, but the less you trade, the better you will perform. Why is that?
You have a Performance Edge You will always have an Edge over the other traders.
Traders who spend 8 hours on charts never have an edge. They get beaten by traders who spend 1 hour a day.
So - pick a trading window and dedicate full focus Take your trades and then rest.
When the market is unclear - Rest.
When there is heavy news - Rest.
And like a sniper - show up Fresh at the right time,
while the impatient are already blown up
One trader's TP is another trader's Stop Loss.
So, who wins at the end?
The Focused, Calm, Emotionally-Intelligent trader will always take the money of the
FOMO, Emotional and Unfocused trader.
So - what can be done to ensure you win?Trading is about Focus
Time = Energy Wasted .
Energy Wasted = Loss of Focus and Edge.
The more time you spend on charts, the more energy you waste, the smaller your edge becomes. It's Counterintuitive, but the less you trade, the better you will perform. Why is that?
You have a Performance Edge You will always have an Edge over the other traders.
Traders who spend 8 hours on charts never have an edge. They get beaten by traders who spend 1 hour a day.
So - pick a trading window and dedicate full focus Take your trades and then rest.
When the market is unclear - Rest.
When there is heavy news - Rest.
And like a sniper - show up Fresh at the right time,
while the impatient are already blown up

FinQuickly
·
--
The Doji Candlestick: Mastering Market Indecision in Technical Analysis
"The Doji Candlestick: Mastering Market Indecision in Technical Analysis 📉📈"
In the world of technical analysis, candlestick patterns are crucial tools that traders use to interpret market sentiment and predict potential price movements. Among these patterns, the Doji candlestick stands out as one of the most important, signaling indecision in the market. Understanding the Doji pattern can help traders make informed decisions about upcoming trends, whether it's spotting a potential reversal or preparing for consolidation. Let’s break down what the Doji candlestick is and why it’s so influential.
1. What is a Doji Candlestick? 📊
A Doji candlestick forms when the opening and closing prices of an asset are almost equal, creating a very small or nonexistent real body on the chart. The wicks (shadows) of the candle, however, can vary in length. The Doji pattern indicates a balance between buying and selling pressure, where neither bulls nor bears have gained control of the market during that specific trading session.
The Doji can appear in any time frame, from one-minute charts to weekly charts, making it a versatile tool for all types of traders.
2. Types of Doji Candlesticks 🚦
There are several variations of the Doji, each with its own market implications:
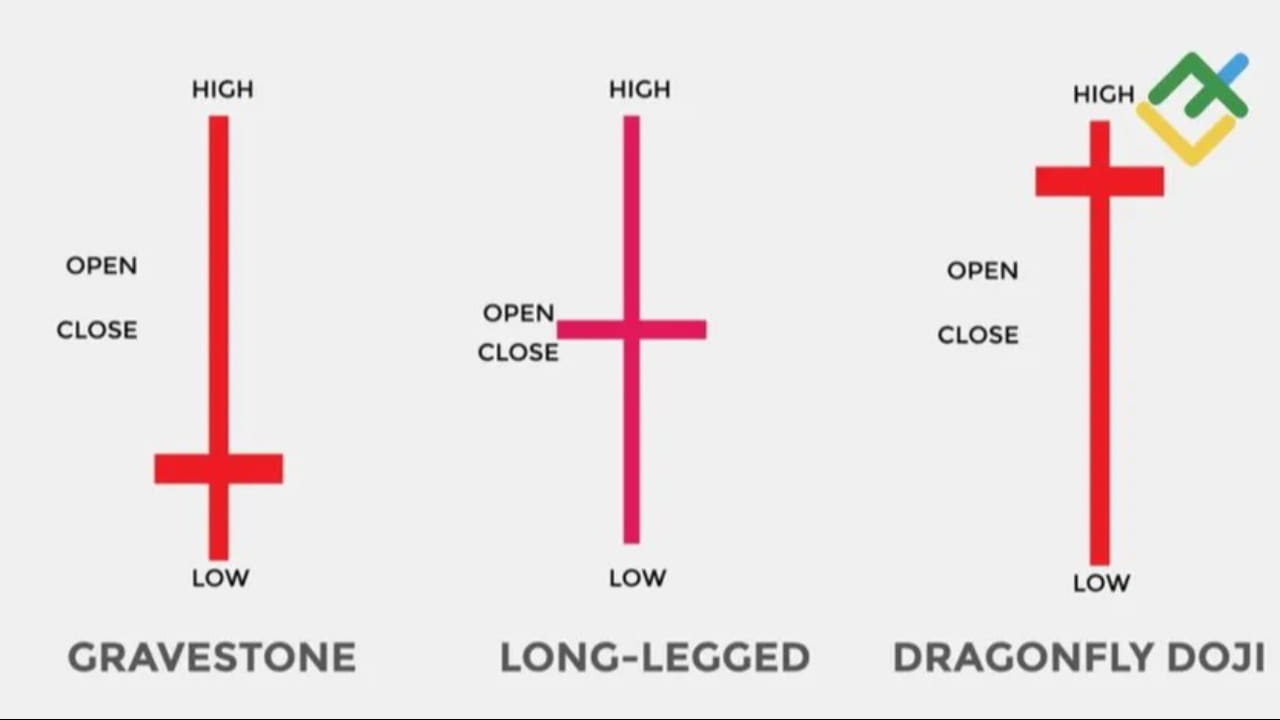
Standard Doji: The classic form where the opening and closing prices are identical, reflecting complete indecision.Gravestone Doji: Has a long upper wick and no lower wick, signaling that buyers initially drove the price higher, but sellers took control by the close. Typically a bearish signal at the top of an uptrend.Dragonfly Doji: Features a long lower wick and no upper wick, indicating sellers pushed the price down but buyers brought it back up. Often a bullish signal at the bottom of a downtrend.Long-Legged Doji: Both upper and lower wicks are long, highlighting extreme indecision with significant price movement but little direction.
3. Interpreting the Doji Pattern: A Signal of Indecision 🤔
When a Doji appears on a chart, it’s a clear indication that the market is undecided. Neither buyers nor sellers have managed to dominate the session, which can suggest a potential reversal or continuation of the current trend, depending on the context.
In an Uptrend: A Doji could signal that buyers are losing strength, potentially indicating a trend reversal to the downside. Traders may see this as a chance to exit or prepare for a short position.
In a Downtrend: Conversely, if a Doji forms during a downtrend, it might mean that sellers are losing momentum, and a bullish reversal could be on the horizon.
"Please show some love ❤️❤️ by liking and commenting, it means the world to me 😢😭! And don’t forget to follow for more insights. Your support helps us keep creating valuable content like this!"
4. Doji as a Part of Larger Patterns 🔄
While the Doji on its own can be a powerful signal, it is often most effective when used in conjunction with other patterns. For instance, a Doji forming at the end of a strong trend might be part of a larger reversal pattern, such as the Morning Star (bullish) or the Evening Star (bearish).
Morning Star: A Doji appearing after a bearish candle and before a bullish candle may form this pattern, signaling a strong reversal to the upside.Evening Star: A Doji that appears after a bullish candle and before a bearish candle could form this pattern, indicating a shift to the downside.
5. Limitations of the Doji Candlestick ⚠️
While the Doji is a helpful signal, it should not be relied upon in isolation. Market context, volume, and other indicators should be considered to confirm any potential trend reversal or continuation. False signals can occur, especially in low-volume markets or during periods of high volatility.
Final Thoughts 🎯
The Doji candlestick is one of the most recognizable and insightful patterns in technical analysis. It reflects market indecision, signaling that traders are at a crossroads. Whether it's the potential for a reversal or just a pause in the current trend, the appearance of a Doji should prompt traders to pay closer attention to upcoming price action. When used with other indicators, the Doji can be a powerful tool in your trading strategy.
In the world of technical analysis, candlestick patterns are crucial tools that traders use to interpret market sentiment and predict potential price movements. Among these patterns, the Doji candlestick stands out as one of the most important, signaling indecision in the market. Understanding the Doji pattern can help traders make informed decisions about upcoming trends, whether it's spotting a potential reversal or preparing for consolidation. Let’s break down what the Doji candlestick is and why it’s so influential.
1. What is a Doji Candlestick? 📊
A Doji candlestick forms when the opening and closing prices of an asset are almost equal, creating a very small or nonexistent real body on the chart. The wicks (shadows) of the candle, however, can vary in length. The Doji pattern indicates a balance between buying and selling pressure, where neither bulls nor bears have gained control of the market during that specific trading session.
The Doji can appear in any time frame, from one-minute charts to weekly charts, making it a versatile tool for all types of traders.
2. Types of Doji Candlesticks 🚦
There are several variations of the Doji, each with its own market implications:
Standard Doji: The classic form where the opening and closing prices are identical, reflecting complete indecision.Gravestone Doji: Has a long upper wick and no lower wick, signaling that buyers initially drove the price higher, but sellers took control by the close. Typically a bearish signal at the top of an uptrend.Dragonfly Doji: Features a long lower wick and no upper wick, indicating sellers pushed the price down but buyers brought it back up. Often a bullish signal at the bottom of a downtrend.Long-Legged Doji: Both upper and lower wicks are long, highlighting extreme indecision with significant price movement but little direction.
3. Interpreting the Doji Pattern: A Signal of Indecision 🤔
When a Doji appears on a chart, it’s a clear indication that the market is undecided. Neither buyers nor sellers have managed to dominate the session, which can suggest a potential reversal or continuation of the current trend, depending on the context.
In an Uptrend: A Doji could signal that buyers are losing strength, potentially indicating a trend reversal to the downside. Traders may see this as a chance to exit or prepare for a short position.
In a Downtrend: Conversely, if a Doji forms during a downtrend, it might mean that sellers are losing momentum, and a bullish reversal could be on the horizon.
"Please show some love ❤️❤️ by liking and commenting, it means the world to me 😢😭! And don’t forget to follow for more insights. Your support helps us keep creating valuable content like this!"
4. Doji as a Part of Larger Patterns 🔄
While the Doji on its own can be a powerful signal, it is often most effective when used in conjunction with other patterns. For instance, a Doji forming at the end of a strong trend might be part of a larger reversal pattern, such as the Morning Star (bullish) or the Evening Star (bearish).
Morning Star: A Doji appearing after a bearish candle and before a bullish candle may form this pattern, signaling a strong reversal to the upside.Evening Star: A Doji that appears after a bullish candle and before a bearish candle could form this pattern, indicating a shift to the downside.
5. Limitations of the Doji Candlestick ⚠️
While the Doji is a helpful signal, it should not be relied upon in isolation. Market context, volume, and other indicators should be considered to confirm any potential trend reversal or continuation. False signals can occur, especially in low-volume markets or during periods of high volatility.
Final Thoughts 🎯
The Doji candlestick is one of the most recognizable and insightful patterns in technical analysis. It reflects market indecision, signaling that traders are at a crossroads. Whether it's the potential for a reversal or just a pause in the current trend, the appearance of a Doji should prompt traders to pay closer attention to upcoming price action. When used with other indicators, the Doji can be a powerful tool in your trading strategy.

Crypto Insiders
·
--
Want to know how understand Candles? Read this article - Practical Guide
Intraday trading is a method of investing in cryptocurrencies where the trader buys and sells cryptocurrencies on the same day without any open positions left by the end of the day. Hence, intraday traders try to either purchase a cryptocurrency at a low price and sell it higher or short-sell a cryptocurrency at a high price and buy it lower within the same day. This requires a good understanding of the market and relevant information that can help them make the right decisions. In the cryptocurrency market, the price of a cryptocurrency is determined by its demand and supply among other factors.
Tools such as candlestick chart patterns offer great help to traders. We will talk about these Candlestick Charts and offer steps to help you read them.
What are Candlestick Graphs/Charts?
Candlesticks are a visual representation of the size of price fluctuations. Traders use these charts to identify patterns and gauge the near-term direction of price in the cryptocurrency market.
Composition of a Candlestick Chart
This is how a candlestick chart pattern looks like:
As you can see, there are several horizontal bars or candles that form this chart. Each candle has three parts:
The BodyUpper ShadowLower Shadow
Also, the body is colored either Red or Green. Each candle is a representation of a time period and the data corresponds to the trades executed during that period.
A candle has four points of data:
How to Analyze Candlestick Chart for Cryptocurrencies
The body of the candle in a candlestick chart represents the opening and closing price of the trading done during the period for a particular cryptocurrency. Understanding this is crucial for candlestick trading. Traders can quickly see the price range of the cryptocurrency for the said period by looking at the chart. Moreover, the color of the body indicates whether the price is rising or falling. For instance, if a candlestick chart for a month with each candle representing a day has more consecutive red candles, then traders know that the cryptocurrency's price is falling.
Vertical lines called wicks or shadows above and below the body show the highs and lows of the traded price of the cryptocurrency. Traders can use this information to analyze the sentiment of the market towards the cryptocurrency.
Candlestick Chart Patterns
Candlestick charts are an excellent way of understanding investor sentiment and the relationship between demand and supply, bears and bulls, greed and fear, etc., in the cryptocurrency market. Traders must remember that while an individual candle provides sufficient information, patterns can be determined only by comparing one candle with its preceding and next candles. To benefit from them, it is important that traders understand patterns in candlestick charts.
Let's divide the patterns into two sections:
Bullish PatternsBearish Patterns
Analyzing these patterns can help traders make informed decisions about buying or selling cryptocurrencies.
Bullish Patterns
Hammer pattern
This is a candle with a short body and a long lower wick. It is usually located at the bottom of a downward trend. It indicates that despite selling pressures, a strong buying surge pushed the prices up. If the body is green, it indicates a stronger bull market than a red body.
Inverse Hammer pattern
This is a candle with a short body and a long upper wick. It is usually located at the bottom of a downward trend too. It indicates buying pressure followed by selling pressure. It also indicates that buyers will soon have control.
Bullish Engulfing pattern
This is a pattern of two candlesticks where the first candle is a short red one engulfed by a large green candle. It indicates a bullish market that pushes the price up despite opening lower than the previous day.
Piercing Line pattern
This is a two-candle pattern having a long red candle followed by a long green candle. Also, the closing price of the second candle must be more than half-way up the body of the first candle. This indicates strong buying pressure.
Morning Star pattern
This is a three-candle pattern that has one candle with a short body between one long red and a long green candle. There is usually no overlap between the short and the long candles. This is an indication of the reduction of the selling pressure and the onset of a bull market.
Three White Soldiers pattern
This is a three-candle pattern that has three green candles with small wicks. These candles open and close higher than the previous day. After a downtrend, this is a strong indication of an upcoming bull trend.
Bearish Patterns
Hanging Man pattern
This is a candle with a short body and a long lower wick. It is usually located at the top of an upward trend. It indicates that the selling pressures were stronger than the buying thrust. It also indicates that bears are gaining control of the market.
Shooting Star pattern
This is a candle with a short body and a long upper wick. It is usually located at the top of an upward trend too. Usually, the market opens higher than the previous day and rallies a bit before crashing like a shooting star. It indicates selling pressure taking over the market.
Bearish Engulfing pattern
In candlestick chart analysis, this is a pattern of two candlesticks where the first candle is a short green one engulfed by a large red candle. It usually occurs at the top of an upward trend. It indicates a slowdown in the market rise and an upcoming downtrend. If the red candle is lower, the downtrend is usually more significant.
Evening Star pattern
This is a three-candle pattern that has one candle with a short body between one long red and a long green candle. There is usually no overlap between the short and the long candles. This is an indication of the reversal of an upward trend. This is more significant if the third candle overcomes the gains of the first candle.
Three Black Crows pattern
This is a three-candle pattern that has three consecutive red candles with short wicks. These candles open and close lower than the previous day. After an upward trend, this is a strong indication of an upcoming bear market.
Chart patterns can be used to understand trends and sentiment of the cryptocurrency markets. There are several other patterns to explore in order to gain a deeper understanding of market movements. Use this as a starting point and continue to learn and refine your analysis skills.
Happy trades and successful investments!💪👊
@Crypto Insiders
#candles #BTC $BTC
$ETH
$BNB
Tools such as candlestick chart patterns offer great help to traders. We will talk about these Candlestick Charts and offer steps to help you read them.
What are Candlestick Graphs/Charts?
Candlesticks are a visual representation of the size of price fluctuations. Traders use these charts to identify patterns and gauge the near-term direction of price in the cryptocurrency market.
Composition of a Candlestick Chart
This is how a candlestick chart pattern looks like:
As you can see, there are several horizontal bars or candles that form this chart. Each candle has three parts:
The BodyUpper ShadowLower Shadow
Also, the body is colored either Red or Green. Each candle is a representation of a time period and the data corresponds to the trades executed during that period.
A candle has four points of data:
How to Analyze Candlestick Chart for Cryptocurrencies
The body of the candle in a candlestick chart represents the opening and closing price of the trading done during the period for a particular cryptocurrency. Understanding this is crucial for candlestick trading. Traders can quickly see the price range of the cryptocurrency for the said period by looking at the chart. Moreover, the color of the body indicates whether the price is rising or falling. For instance, if a candlestick chart for a month with each candle representing a day has more consecutive red candles, then traders know that the cryptocurrency's price is falling.
Vertical lines called wicks or shadows above and below the body show the highs and lows of the traded price of the cryptocurrency. Traders can use this information to analyze the sentiment of the market towards the cryptocurrency.
Candlestick Chart Patterns
Candlestick charts are an excellent way of understanding investor sentiment and the relationship between demand and supply, bears and bulls, greed and fear, etc., in the cryptocurrency market. Traders must remember that while an individual candle provides sufficient information, patterns can be determined only by comparing one candle with its preceding and next candles. To benefit from them, it is important that traders understand patterns in candlestick charts.
Let's divide the patterns into two sections:
Bullish PatternsBearish Patterns
Analyzing these patterns can help traders make informed decisions about buying or selling cryptocurrencies.
Bullish Patterns
Hammer pattern
This is a candle with a short body and a long lower wick. It is usually located at the bottom of a downward trend. It indicates that despite selling pressures, a strong buying surge pushed the prices up. If the body is green, it indicates a stronger bull market than a red body.
Inverse Hammer pattern
This is a candle with a short body and a long upper wick. It is usually located at the bottom of a downward trend too. It indicates buying pressure followed by selling pressure. It also indicates that buyers will soon have control.
Bullish Engulfing pattern
This is a pattern of two candlesticks where the first candle is a short red one engulfed by a large green candle. It indicates a bullish market that pushes the price up despite opening lower than the previous day.
Piercing Line pattern
This is a two-candle pattern having a long red candle followed by a long green candle. Also, the closing price of the second candle must be more than half-way up the body of the first candle. This indicates strong buying pressure.
Morning Star pattern
This is a three-candle pattern that has one candle with a short body between one long red and a long green candle. There is usually no overlap between the short and the long candles. This is an indication of the reduction of the selling pressure and the onset of a bull market.
Three White Soldiers pattern
This is a three-candle pattern that has three green candles with small wicks. These candles open and close higher than the previous day. After a downtrend, this is a strong indication of an upcoming bull trend.
Bearish Patterns
Hanging Man pattern
This is a candle with a short body and a long lower wick. It is usually located at the top of an upward trend. It indicates that the selling pressures were stronger than the buying thrust. It also indicates that bears are gaining control of the market.
Shooting Star pattern
This is a candle with a short body and a long upper wick. It is usually located at the top of an upward trend too. Usually, the market opens higher than the previous day and rallies a bit before crashing like a shooting star. It indicates selling pressure taking over the market.
Bearish Engulfing pattern
In candlestick chart analysis, this is a pattern of two candlesticks where the first candle is a short green one engulfed by a large red candle. It usually occurs at the top of an upward trend. It indicates a slowdown in the market rise and an upcoming downtrend. If the red candle is lower, the downtrend is usually more significant.
Evening Star pattern
This is a three-candle pattern that has one candle with a short body between one long red and a long green candle. There is usually no overlap between the short and the long candles. This is an indication of the reversal of an upward trend. This is more significant if the third candle overcomes the gains of the first candle.
Three Black Crows pattern
This is a three-candle pattern that has three consecutive red candles with short wicks. These candles open and close lower than the previous day. After an upward trend, this is a strong indication of an upcoming bear market.
Chart patterns can be used to understand trends and sentiment of the cryptocurrency markets. There are several other patterns to explore in order to gain a deeper understanding of market movements. Use this as a starting point and continue to learn and refine your analysis skills.
Happy trades and successful investments!💪👊
@Crypto Insiders
#candles #BTC $BTC
$ETH
$BNB


Crypto_Alchemy
·
--
Protect Your Binance Account from Hackers: Stay Vigilant!
Hackers employ various tactics to compromise Binance accounts and steal assets. Be aware of these common techniques to safeguard your account:
1. Social Engineering: Hackers manipulate users into revealing sensitive information through phishing emails, fake calls, or deceptive messages. Verify sources and be cautious!
2. Password Hacking: Hackers use brute force attacks to guess passwords. Use strong, unique passwords and enable 2FA.
3. Phishing Emails: Fake emails mimic Binance or related services, tricking users into clicking malicious links or entering credentials on fake websites. Check sender addresses and verify links.
4. SIM Swapping: Hackers gain control of your phone number to intercept 2FA codes. Secure your phone number and contact your provider if you suspect foul play.
5. Malware: Malicious software like keyloggers tracks keystrokes to capture login details. Avoid unknown downloads and keep your system protected.
6. Man-in-the-Middle Attacks (MITM): Hackers intercept communications between you and Binance, especially on unsecured networks. Use secure connections and avoid public Wi-Fi.
7. API Exploits: Hackers exploit poorly secured or poorly coded APIs connected to your account. Be cautious with third-party services and review API permissions regularly.
8. Dusting Attacks: Small cryptocurrency amounts are sent to track transactions and identify your true identity. Regularly check your account for unexpected transactions.
Stay safe by:
- Using strong passwords and enabling 2FA
- Avoiding suspicious links and emails
- Securing your devices and network
- Staying informed about security best practices
Protect your assets and remain vigilant!
#dogs #USNonFarmPayrollReport #TON #KryptoAlchemy
1. Social Engineering: Hackers manipulate users into revealing sensitive information through phishing emails, fake calls, or deceptive messages. Verify sources and be cautious!
2. Password Hacking: Hackers use brute force attacks to guess passwords. Use strong, unique passwords and enable 2FA.
3. Phishing Emails: Fake emails mimic Binance or related services, tricking users into clicking malicious links or entering credentials on fake websites. Check sender addresses and verify links.
4. SIM Swapping: Hackers gain control of your phone number to intercept 2FA codes. Secure your phone number and contact your provider if you suspect foul play.
5. Malware: Malicious software like keyloggers tracks keystrokes to capture login details. Avoid unknown downloads and keep your system protected.
6. Man-in-the-Middle Attacks (MITM): Hackers intercept communications between you and Binance, especially on unsecured networks. Use secure connections and avoid public Wi-Fi.
7. API Exploits: Hackers exploit poorly secured or poorly coded APIs connected to your account. Be cautious with third-party services and review API permissions regularly.
8. Dusting Attacks: Small cryptocurrency amounts are sent to track transactions and identify your true identity. Regularly check your account for unexpected transactions.
Stay safe by:
- Using strong passwords and enabling 2FA
- Avoiding suspicious links and emails
- Securing your devices and network
- Staying informed about security best practices
Protect your assets and remain vigilant!
#dogs #USNonFarmPayrollReport #TON #KryptoAlchemy

KasonsoC
·
--
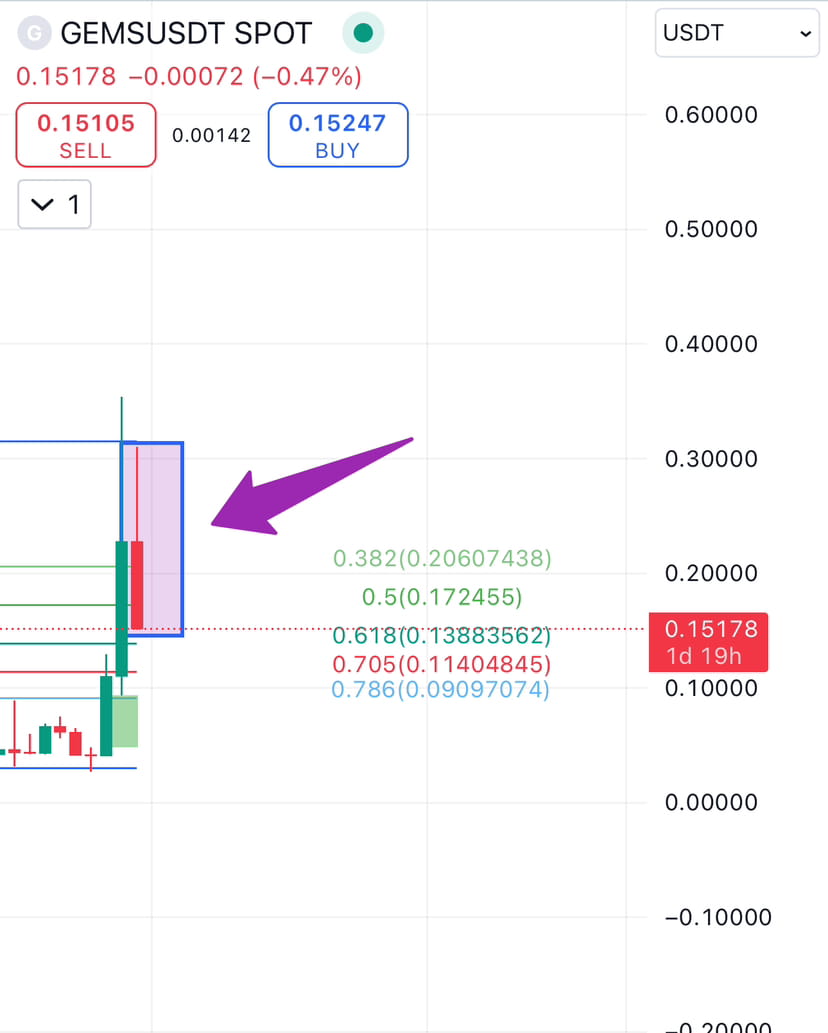
FORMATION OF BABY CANDLE TO GENERATE PROFIT😊
An inside bar candlestick is a price pattern that occurs on a candlestick chart, typically indicating a period of consolidation or indecision in the market. Here’s a breakdown of its characteristics and significance:
▎Characteristics:
1. Formation: An inside bar consists of two candles:
- The first candle (the "mother bar") has a larger body and range.
- The second candle (the "inside bar") is contained entirely within the high and low of the mother bar.
2. Size: The inside bar generally has a smaller body compared to the mother bar, reflecting reduced volatility.
▎Significance:
- Market Indecision: The formation suggests that buyers and sellers are in balance, leading to a pause in the prevailing trend.
- Potential Breakout: Traders often look for a breakout above the high or below the low of the mother bar as a signal to enter a trade. A breakout can indicate a continuation of the previous trend or a reversal.
- Trend Context: The significance of an inside bar can vary depending on its location within a trend (e.g., at the top of an uptrend or bottom of a downtrend).
▎Trading Strategies:
1. Breakout Trading: Traders may place buy orders above the mother bar's high and sell orders below its low.
2. Risk Management: Stop-loss orders can be placed just outside the mother bar to limit potential losses.
3. Confirmation: Some traders wait for additional confirmation (like volume increase or other indicators) before acting on an inside bar signal.
▎Example:
If the mother bar has a high of $100 and a low of $90, an inside bar might have a high of $95 and a low of $92. Traders would watch for price action to break above $100 or below $90 for potential trading opportunities.
▎Conclusion:
Inside bars can be powerful indicators in technical analysis, providing insights into market sentiment and potential future price movements. However, like all trading signals, they should be used in conjunction with other tools and analysis methods for better decision-making.
#CryptoForEveryone
An inside bar candlestick is a price pattern that occurs on a candlestick chart, typically indicating a period of consolidation or indecision in the market. Here’s a breakdown of its characteristics and significance:
▎Characteristics:
1. Formation: An inside bar consists of two candles:
- The first candle (the "mother bar") has a larger body and range.
- The second candle (the "inside bar") is contained entirely within the high and low of the mother bar.
2. Size: The inside bar generally has a smaller body compared to the mother bar, reflecting reduced volatility.
▎Significance:
- Market Indecision: The formation suggests that buyers and sellers are in balance, leading to a pause in the prevailing trend.
- Potential Breakout: Traders often look for a breakout above the high or below the low of the mother bar as a signal to enter a trade. A breakout can indicate a continuation of the previous trend or a reversal.
- Trend Context: The significance of an inside bar can vary depending on its location within a trend (e.g., at the top of an uptrend or bottom of a downtrend).
▎Trading Strategies:
1. Breakout Trading: Traders may place buy orders above the mother bar's high and sell orders below its low.
2. Risk Management: Stop-loss orders can be placed just outside the mother bar to limit potential losses.
3. Confirmation: Some traders wait for additional confirmation (like volume increase or other indicators) before acting on an inside bar signal.
▎Example:
If the mother bar has a high of $100 and a low of $90, an inside bar might have a high of $95 and a low of $92. Traders would watch for price action to break above $100 or below $90 for potential trading opportunities.
▎Conclusion:
Inside bars can be powerful indicators in technical analysis, providing insights into market sentiment and potential future price movements. However, like all trading signals, they should be used in conjunction with other tools and analysis methods for better decision-making.
#CryptoForEveryone

Yoga Arsana
·
--
5 Mistakes Beginner Crypto Investors Make!
Many crypto investors lose money in the crypto market, what do you think is the cause? Let's discuss in more depth the five common mistakes that beginner crypto investors often make, and how to avoid them with more detailed steps:
1. Lack of Research and Education
Mistake: Beginner investors often invest in cryptocurrency without understanding what they are buying. They may buy coins based on trends or recommendations without doing their due diligence.
1. Lack of Research and Education
Mistake: Beginner investors often invest in cryptocurrency without understanding what they are buying. They may buy coins based on trends or recommendations without doing their due diligence.


Supermacho
·
--
How This Crypto Trader Turned $98 Into $1.1M in 91 Days 🚀💰
In the fast-paced world of cryptocurrency, there are stories that capture the imagination and fuel the dreams of traders everywhere. One such story is that of a crypto trader who transformed a modest $98 investment into a staggering $1.1 million in just 91 days! Let’s dive into the strategies and key moves that made this incredible feat possible.
👇👇👇
$LTC
The Power of Timing and Strategy ⏰📈
The trader's success wasn't just about luck; it was the result of careful planning, calculated risks, and impeccable timing. Here’s how it unfolded:
1. Spotting Early Opportunities: The trader had a knack for identifying cryptocurrencies that were undervalued but had strong potential for growth. By investing early in these projects, they were able to buy in at low prices before the market caught on.
2. Diversification and Risk Management: Rather than putting all $98 into a single coin, the trader diversified their investment across several promising altcoins. This approach reduced risk while maximizing the chances of hitting big on one or more of the investments.
3. Riding the Waves 🌊: In the volatile crypto market, prices can swing wildly in short periods. The trader was skilled at riding these waves, buying low and selling high, and then reinvesting profits into new opportunities.
4. Leveraging DeFi and Yield Farming 🌾: The trader also took advantage of decentralized finance (DeFi) protocols to earn passive income through yield farming and staking. These strategies not only generated additional returns but also compounded the gains over time.
5. Staying Informed and Adapting 📚: Staying on top of market trends, news, and developments in the crypto space was crucial. The trader was always informed about what was happening in the market, allowing them to make quick and informed decisions.
👇👇👇
$SOL
The Key Takeaways 🔑
This story highlights several important lessons for anyone looking to succeed in the crypto market:
- Research and Education: Understanding the market, the technology behind cryptocurrencies, and the projects you’re investing in is critical. The trader’s success was built on a foundation of knowledge and continuous learning.
- Patience and Discipline: Turning $98 into $1.1 million didn’t happen overnight. It required patience, discipline, and the ability to stay calm during market fluctuations.
- Taking Calculated Risks: While the gains were extraordinary, they came from taking calculated risks rather than reckless gambles. The trader knew when to hold and when to sell, balancing the potential for reward with the risk of loss.
Conclusion: A Tale of Crypto Success 🌟
The story of turning $98 into $1.1 million in just 91 days is a testament to the incredible opportunities available in the cryptocurrency market. While such dramatic success is rare, it shows what’s possible with the right strategy, timing, and a bit of daring.
For aspiring traders, this story serves as both an inspiration and a reminder of the importance of research, risk management, and staying informed. The crypto market can be unpredictable, but with the right approach, extraordinary gains are within reach.
👇👇👇
$BNB
#SolanaUSTD #ETHETFsApproved #altsesaon #CryptoMarketMoves #SuperMacho
👇👇👇
$LTC
The Power of Timing and Strategy ⏰📈
The trader's success wasn't just about luck; it was the result of careful planning, calculated risks, and impeccable timing. Here’s how it unfolded:
1. Spotting Early Opportunities: The trader had a knack for identifying cryptocurrencies that were undervalued but had strong potential for growth. By investing early in these projects, they were able to buy in at low prices before the market caught on.
2. Diversification and Risk Management: Rather than putting all $98 into a single coin, the trader diversified their investment across several promising altcoins. This approach reduced risk while maximizing the chances of hitting big on one or more of the investments.
3. Riding the Waves 🌊: In the volatile crypto market, prices can swing wildly in short periods. The trader was skilled at riding these waves, buying low and selling high, and then reinvesting profits into new opportunities.
4. Leveraging DeFi and Yield Farming 🌾: The trader also took advantage of decentralized finance (DeFi) protocols to earn passive income through yield farming and staking. These strategies not only generated additional returns but also compounded the gains over time.
5. Staying Informed and Adapting 📚: Staying on top of market trends, news, and developments in the crypto space was crucial. The trader was always informed about what was happening in the market, allowing them to make quick and informed decisions.
👇👇👇
$SOL
The Key Takeaways 🔑
This story highlights several important lessons for anyone looking to succeed in the crypto market:
- Research and Education: Understanding the market, the technology behind cryptocurrencies, and the projects you’re investing in is critical. The trader’s success was built on a foundation of knowledge and continuous learning.
- Patience and Discipline: Turning $98 into $1.1 million didn’t happen overnight. It required patience, discipline, and the ability to stay calm during market fluctuations.
- Taking Calculated Risks: While the gains were extraordinary, they came from taking calculated risks rather than reckless gambles. The trader knew when to hold and when to sell, balancing the potential for reward with the risk of loss.
Conclusion: A Tale of Crypto Success 🌟
The story of turning $98 into $1.1 million in just 91 days is a testament to the incredible opportunities available in the cryptocurrency market. While such dramatic success is rare, it shows what’s possible with the right strategy, timing, and a bit of daring.
For aspiring traders, this story serves as both an inspiration and a reminder of the importance of research, risk management, and staying informed. The crypto market can be unpredictable, but with the right approach, extraordinary gains are within reach.
👇👇👇
$BNB
#SolanaUSTD #ETHETFsApproved #altsesaon #CryptoMarketMoves #SuperMacho

Kripto ve Kazanç Kralı
·
--
💥💥Analyst Says Bitcoin's Decline Will Continue Answers the Question "What is Needed for the Rally to Start"! 💥💥
Recently, Bitcoin's price increases have generally been short-lived, and there is still uncertainty about when BTC will return to the uptrend.
There are various opinions among analysts on this subject. Well-known cryptocurrency analyst Benjamin Cowen stated in a recent YouTube video that Bitcoin could remain in a downtrend until the end of 2024. Cowen relates this prediction to the FED's interest rate cut decisions and states that it is unlikely that BTC will switch to an uptrend without the FED lowering interest rates by at least 75 basis points.
In a more optimistic scenario, Cowen predicts that if the neutral interest rate is higher than the FED's estimates, interest rate cuts could break the downtrend in Bitcoin.
"How long can the downtrend last before the trend changes? I think this trend could continue until the end of the year. Frankly, this prediction seems reasonable to me. If the neutral interest rate is higher than the Fed expects, the downtrend could break in October as interest rate cuts begin.” Cowen states that if the Fed lowers interest rates below the neutral rate, the downtrend could end in September, but he emphasizes that this is a more optimistic scenario. He makes a more moderate estimate, adding that the decline could last until the end of the year and that a rate cut of approximately 75 basis points would be necessary during this process.
“If no rate cut occurs by the end of the year, we could enter an uptrend again in January 2025.”
My dear friends, please do not withhold your free support. I try to bring you such news instantly. My only request from you is that if there is someone who is not following me yet, I would be happy if they did. Please like my articles and posts. Thank you.
Recently, Bitcoin's price increases have generally been short-lived, and there is still uncertainty about when BTC will return to the uptrend.
There are various opinions among analysts on this subject. Well-known cryptocurrency analyst Benjamin Cowen stated in a recent YouTube video that Bitcoin could remain in a downtrend until the end of 2024. Cowen relates this prediction to the FED's interest rate cut decisions and states that it is unlikely that BTC will switch to an uptrend without the FED lowering interest rates by at least 75 basis points.
In a more optimistic scenario, Cowen predicts that if the neutral interest rate is higher than the FED's estimates, interest rate cuts could break the downtrend in Bitcoin.
"How long can the downtrend last before the trend changes? I think this trend could continue until the end of the year. Frankly, this prediction seems reasonable to me. If the neutral interest rate is higher than the Fed expects, the downtrend could break in October as interest rate cuts begin.” Cowen states that if the Fed lowers interest rates below the neutral rate, the downtrend could end in September, but he emphasizes that this is a more optimistic scenario. He makes a more moderate estimate, adding that the decline could last until the end of the year and that a rate cut of approximately 75 basis points would be necessary during this process.
“If no rate cut occurs by the end of the year, we could enter an uptrend again in January 2025.”
My dear friends, please do not withhold your free support. I try to bring you such news instantly. My only request from you is that if there is someone who is not following me yet, I would be happy if they did. Please like my articles and posts. Thank you.

U.today
·
--
Satoshi-Era Bitcoin Address Activated After More Than 13 Years
A Bitcoin wallet that dates back all the way back to 2011 was recently activated, according to data provided by Whale Alert.
The wallet, which sprung back to life after more than 13 years of inactivity, contains 23 BTC (roughly $1.35 million at press time).
A slew of long-dormant Bitcoin wallets have been activated throughout this month.
On Thursday, for instance, a dormant address containing 100 BTC (roughly $5.94 million at the time of the transaction) got activated after 11.4 years. Back in 2013, it had a mere $14,202 worth of Bitcoin.
On Monday, a Bitcoin wallet with 25 BTC (roughly $1.58 million) emerged from hibernation after 11.5 years of inactivity.
card
Yet, wallets that date back all the way to 2011, the year Satoshi Nakamoto disappeared, are pretty rare. Apart from the most recent activation, there has been only one such transaction during this August. On Aug. 25, a dormant address containing 64 BTC ($4.14 million)
Satoshi Nakamoto, the mysterious Bitcoin creator, famously sent his last email on Apr. 26, 2011. In one of his final emails, Nakamoto stated that he had moved on to some other things while adding that Bitcoin was "in good hands." In his final email to prominent software developer Gavin Andresen, Nakamoto indicated that he did not want to be perceived as a shadowy figure while emphasizing Bitcoin's open-source nature.
card
As reported by U.Today, a Bitcoin miner address from 2010, the era of CPU mining, was activated after 14 years of inactivity in late June. Such activations tend to be exceptionally rare.
The wallet, which sprung back to life after more than 13 years of inactivity, contains 23 BTC (roughly $1.35 million at press time).
A slew of long-dormant Bitcoin wallets have been activated throughout this month.
On Thursday, for instance, a dormant address containing 100 BTC (roughly $5.94 million at the time of the transaction) got activated after 11.4 years. Back in 2013, it had a mere $14,202 worth of Bitcoin.
On Monday, a Bitcoin wallet with 25 BTC (roughly $1.58 million) emerged from hibernation after 11.5 years of inactivity.
card
Yet, wallets that date back all the way to 2011, the year Satoshi Nakamoto disappeared, are pretty rare. Apart from the most recent activation, there has been only one such transaction during this August. On Aug. 25, a dormant address containing 64 BTC ($4.14 million)
Satoshi Nakamoto, the mysterious Bitcoin creator, famously sent his last email on Apr. 26, 2011. In one of his final emails, Nakamoto stated that he had moved on to some other things while adding that Bitcoin was "in good hands." In his final email to prominent software developer Gavin Andresen, Nakamoto indicated that he did not want to be perceived as a shadowy figure while emphasizing Bitcoin's open-source nature.
card
As reported by U.Today, a Bitcoin miner address from 2010, the era of CPU mining, was activated after 14 years of inactivity in late June. Such activations tend to be exceptionally rare.


Tokentraverse
·
--
Bitcoin’s September Struggles: What to Expect for This Month
Historically, September has proven to be a challenging month for Bitcoin (BTC), with the leading cryptocurrency frequently experiencing losses during this time of year.
According to data from Coinglass, Bitcoin has seen a decline in value during eight of the last eleven Septembers, with losses ranging from 1.76% to a staggering 19.01%. On average, Bitcoin has dropped by 4.78% in September, making it one of the most notoriously bearish months for the cryptocurrency. As we enter September 2024, the question on every investor's mind is whether history will repeat itself or if Bitcoin can break the trend this time around.
A Look Back: September's Impact on Bitcoin
September's historical performance stands out starkly against Bitcoin's overall growth trend. The month has consistently posed challenges, and understanding the reasons behind these declines can provide insight into what might happen this year.
Key Historical Data:
- 2023: A decline of -3.12% followed by a strong recovery in October.
- 2022: A sharper drop of -3.12%, setting the stage for a more volatile market environment in Q4.
- 2021: Bitcoin fell by -7.03% in September, leading to a prolonged period of uncertainty before the year-end rally.
- 2020: Despite the ongoing bull run, September 2020 saw a -7.51% decline, indicating that even in strong years, September remains a difficult month for BTC.
Wider Market Implications:
- Market Sentiment: September’s declines are often attributed to end-of-quarter financial adjustments by institutional investors, regulatory concerns, and shifts in market sentiment. This month often sees a pullback as traders reassess their positions, lock in profits, and prepare for the final quarter of the year.
- Macroeconomic Factors: September also tends to coincide with broader economic events, such as fiscal year ends and policy announcements from central banks, which can introduce additional volatility to the market.
Analyzing September 2024: Will the Trend Continue?
As we navigate through September 2024, several factors could influence whether Bitcoin will follow its historical pattern of decline or if this year will buck the trend.
Bullish Indicators:
- Early Year Strength:
Bitcoin has shown significant strength earlier in the year, with notable gains in January (+0.62%), February (+43.55%), and March (+16.81%). This momentum could carry over into September, particularly if macroeconomic conditions remain favorable.
- nstitutional Interest: Increased institutional adoption and the broader acceptance of Bitcoin as a hedge against inflation could provide a more stable foundation, potentially mitigating some of the historical September losses.
Bearish Indicators:
- Seasonal Trends: The historical data is difficult to ignore. The consistency with which Bitcoin has faced declines in September suggests that investors should be cautious. If the past is any guide, this month could once again see a pullback.
- Market Uncertainty: Ongoing economic uncertainties, including inflationary pressures and global geopolitical tensions, could exacerbate market fears, leading to a sell-off that aligns with historical trends.
Strategic Recommendations for September 2024
Given the historical performance of #bitcoiBitcoin in September and the mixed indicators this year, here are some strategies that investors might consider:
1. Risk Management:
With September’s historical volatility in mind, this month might be an ideal time to implement stricter risk management strategies. Setting stop-loss orders to protect against significant downturns could help mitigate potential losses if the market moves against you.
2. Short-Term Trading Opportunities:
For traders, the historical tendency for September to experience downward pressure could present short-term trading opportunities. If early indicators show a similar trend this year, short positions or hedging strategies might be profitable.
3. Long-Term Perspective:
Despite the historical data, it’s essential to remember that Bitcoin's long-term trajectory remains upward. Long-term holders may choose to weather any potential September storm, viewing any dip as a buying opportunity in anticipation of a Q4 rally, which historically tends to follow September’s declines.
What to Watch for in September 2024
As September progresses, keep an eye on the following factors, which could influence Bitcoin’s price action:
- Economic Data Releases:
Key economic indicators, such as inflation reports and central bank announcements, could sway market sentiment.
Regulatory Developments: Any significant news regarding cryptocurrency regulation could either dampen or boost market confidence.
Market Sentiment: Track Bitcoin’s performance in the early days of September. If the market shows signs of weakness, it could signal that this year will follow the historical pattern.
Conclusion
September has historically been a tough month for Bitcoin, with the data showing a consistent pattern of declines over the past decade. However, the dynamics of the cryptocurrency market are ever-evolving, and while history provides valuable insights, it is not always a perfect predictor of the future. As we move through September 2024, investors should stay informed, remain cautious, and consider both the historical trends and the current market conditions when making their trading decisions.
Trading Recommendation: 📉 Given the historical performance, consider a short position in Bitcoin this September with a stop loss set at $65,000 and a take profit target at $52,000
#bitcoin☀️ #BTC☀ $BTC
#CryptoMarketMoves #BlackRockETHOptions #DOGSONBINANCE
According to data from Coinglass, Bitcoin has seen a decline in value during eight of the last eleven Septembers, with losses ranging from 1.76% to a staggering 19.01%. On average, Bitcoin has dropped by 4.78% in September, making it one of the most notoriously bearish months for the cryptocurrency. As we enter September 2024, the question on every investor's mind is whether history will repeat itself or if Bitcoin can break the trend this time around.
A Look Back: September's Impact on Bitcoin
September's historical performance stands out starkly against Bitcoin's overall growth trend. The month has consistently posed challenges, and understanding the reasons behind these declines can provide insight into what might happen this year.
Key Historical Data:
- 2023: A decline of -3.12% followed by a strong recovery in October.
- 2022: A sharper drop of -3.12%, setting the stage for a more volatile market environment in Q4.
- 2021: Bitcoin fell by -7.03% in September, leading to a prolonged period of uncertainty before the year-end rally.
- 2020: Despite the ongoing bull run, September 2020 saw a -7.51% decline, indicating that even in strong years, September remains a difficult month for BTC.
Wider Market Implications:
- Market Sentiment: September’s declines are often attributed to end-of-quarter financial adjustments by institutional investors, regulatory concerns, and shifts in market sentiment. This month often sees a pullback as traders reassess their positions, lock in profits, and prepare for the final quarter of the year.
- Macroeconomic Factors: September also tends to coincide with broader economic events, such as fiscal year ends and policy announcements from central banks, which can introduce additional volatility to the market.
Analyzing September 2024: Will the Trend Continue?
As we navigate through September 2024, several factors could influence whether Bitcoin will follow its historical pattern of decline or if this year will buck the trend.
Bullish Indicators:
- Early Year Strength:
Bitcoin has shown significant strength earlier in the year, with notable gains in January (+0.62%), February (+43.55%), and March (+16.81%). This momentum could carry over into September, particularly if macroeconomic conditions remain favorable.
- nstitutional Interest: Increased institutional adoption and the broader acceptance of Bitcoin as a hedge against inflation could provide a more stable foundation, potentially mitigating some of the historical September losses.
Bearish Indicators:
- Seasonal Trends: The historical data is difficult to ignore. The consistency with which Bitcoin has faced declines in September suggests that investors should be cautious. If the past is any guide, this month could once again see a pullback.
- Market Uncertainty: Ongoing economic uncertainties, including inflationary pressures and global geopolitical tensions, could exacerbate market fears, leading to a sell-off that aligns with historical trends.
Strategic Recommendations for September 2024
Given the historical performance of #bitcoiBitcoin in September and the mixed indicators this year, here are some strategies that investors might consider:
1. Risk Management:
With September’s historical volatility in mind, this month might be an ideal time to implement stricter risk management strategies. Setting stop-loss orders to protect against significant downturns could help mitigate potential losses if the market moves against you.
2. Short-Term Trading Opportunities:
For traders, the historical tendency for September to experience downward pressure could present short-term trading opportunities. If early indicators show a similar trend this year, short positions or hedging strategies might be profitable.
3. Long-Term Perspective:
Despite the historical data, it’s essential to remember that Bitcoin's long-term trajectory remains upward. Long-term holders may choose to weather any potential September storm, viewing any dip as a buying opportunity in anticipation of a Q4 rally, which historically tends to follow September’s declines.
What to Watch for in September 2024
As September progresses, keep an eye on the following factors, which could influence Bitcoin’s price action:
- Economic Data Releases:
Key economic indicators, such as inflation reports and central bank announcements, could sway market sentiment.
Regulatory Developments: Any significant news regarding cryptocurrency regulation could either dampen or boost market confidence.
Market Sentiment: Track Bitcoin’s performance in the early days of September. If the market shows signs of weakness, it could signal that this year will follow the historical pattern.
Conclusion
September has historically been a tough month for Bitcoin, with the data showing a consistent pattern of declines over the past decade. However, the dynamics of the cryptocurrency market are ever-evolving, and while history provides valuable insights, it is not always a perfect predictor of the future. As we move through September 2024, investors should stay informed, remain cautious, and consider both the historical trends and the current market conditions when making their trading decisions.
Trading Recommendation: 📉 Given the historical performance, consider a short position in Bitcoin this September with a stop loss set at $65,000 and a take profit target at $52,000
#bitcoin☀️ #BTC☀ $BTC
#CryptoMarketMoves #BlackRockETHOptions #DOGSONBINANCE
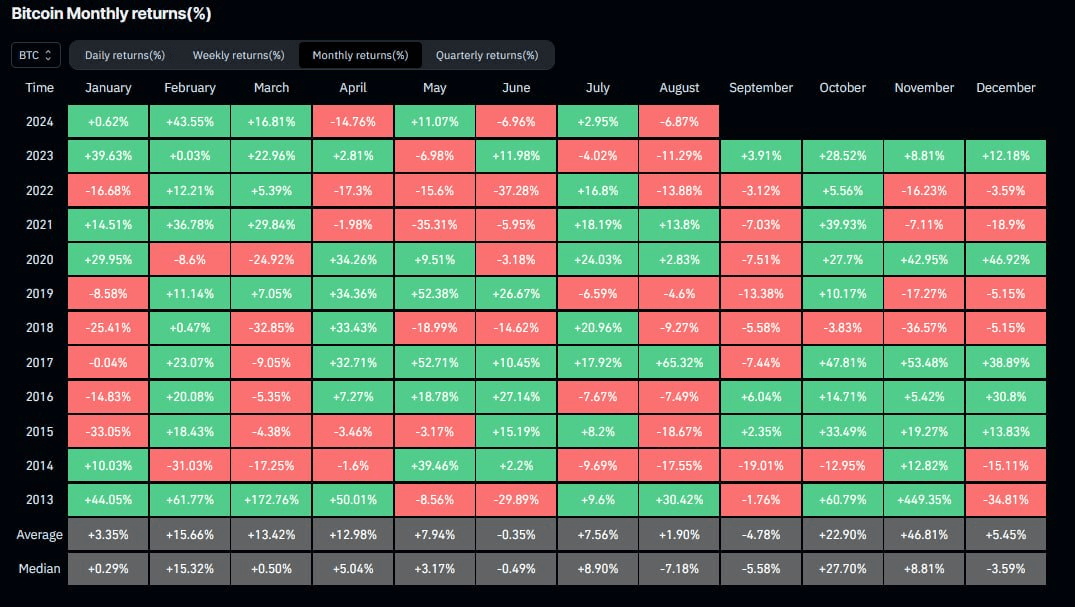


Binance News
·
--
BTC And ETH Options Set To Expire With Significant Market Impact
According to BlockBeats, on August 30, Greeks.live researcher Adam shared data on social media regarding today's options expiration. A total of 62,000 BTC options are set to expire, with a Put Call Ratio of 0.59 and a maximum pain point of $61,000, amounting to a nominal value of $3.66 billion. Additionally, 530,000 ETH options are due to expire, with a Put Call Ratio of 0.49 and a maximum pain point of $2,800, representing a nominal value of $1.34 billion.
Today marks the monthly expiration, and the options data clearly indicates a weakness in ETH this month, with the maximum pain point and expiration price differing by more than 10%. Mid-to-long-term implied volatility (IV) has increased, while short-to-medium-term IV has decreased, suggesting limited overall decline in IV. Historical trading data shows that September is typically a transitional month from weakness to strength, with the fourth quarter generally being a robust period for BTC. Recently, several large investors have begun positioning for October, hoping for favorable market conditions in the final four months of the year.
Today marks the monthly expiration, and the options data clearly indicates a weakness in ETH this month, with the maximum pain point and expiration price differing by more than 10%. Mid-to-long-term implied volatility (IV) has increased, while short-to-medium-term IV has decreased, suggesting limited overall decline in IV. Historical trading data shows that September is typically a transitional month from weakness to strength, with the fourth quarter generally being a robust period for BTC. Recently, several large investors have begun positioning for October, hoping for favorable market conditions in the final four months of the year.

The Buzzing Bee
·
--
🚀Guide On How to grow your 10$ to 1000$ in short period of time (100% Legit) ⚡🔥
😱 $10 investment turned into $100, then $500, and eventually $1000.
💯 Legit you will feel like you hit the Jackpot🎰 with these strategies . It just unbelievable >>>>>>>>>>>>>>>>
Lets find out‼
An ambitious trader named Chris . Wanted to make some extra cash. He had heard about the crypto market and wanted to try his hand at trading. However, he only had $10 to invest.
Chris knew that he had to be smart with his money if he wanted to make a profit. He started by doing his research on different trading strategies and analyzing market trends. He found a few strategies that he thought would fit his trading style and began experimenting with them strategies and came up with a plan.
CLICK AND VOTE FOR ME ❤ EARN A SHARE
At first, Chris experienced some losses, but he didn't give up. He continued to tweak and refine his strategies until he found the ones that worked best for him. He also decided to invest in a low risk, high reward coins.Chris also learned to manage his risks by setting stop loss orders and taking profits consistently. He didn't let his emotions cloud his judgment and remained disciplined in his trading activities.As Chris became more confident in his skills, he began to increase his position sizes gradually. He also diversified his portfolio, investing in different markets and asset classes.
Next, he decided to utilize a technique called dollar cost averaging. This technique involves investing a fixed amount of money on a regular basis, regardless of market conditions. This helped him to avoid the temptation to buy and sell based on emotional reactions to market fluctuations.
Slowly but surely, Chris' account balance started to grow. He was consistent in his approach, and his hard work paid off. Afterwards decided to reinvest any profits he made back into his portfolio, compounding his gains over time.
As his account balance grew, Chris became more and more excited. He knew he was on the right track and could achieve his goal. He continued to trade with discipline and patience, never losing sight of his end goal. With these strategies in place, Chris watched his portfolio grow.
He was patient, and over time, his $10 investment turned into $100, then $500, and eventually $1000.
💯 Legit you will feel like you hit the Jackpot🎰 with these strategies . It just unbelievable >>>>>>>>>>>>>>>>
Lets find out‼
An ambitious trader named Chris . Wanted to make some extra cash. He had heard about the crypto market and wanted to try his hand at trading. However, he only had $10 to invest.
Chris knew that he had to be smart with his money if he wanted to make a profit. He started by doing his research on different trading strategies and analyzing market trends. He found a few strategies that he thought would fit his trading style and began experimenting with them strategies and came up with a plan.
CLICK AND VOTE FOR ME ❤ EARN A SHARE
At first, Chris experienced some losses, but he didn't give up. He continued to tweak and refine his strategies until he found the ones that worked best for him. He also decided to invest in a low risk, high reward coins.Chris also learned to manage his risks by setting stop loss orders and taking profits consistently. He didn't let his emotions cloud his judgment and remained disciplined in his trading activities.As Chris became more confident in his skills, he began to increase his position sizes gradually. He also diversified his portfolio, investing in different markets and asset classes.
Next, he decided to utilize a technique called dollar cost averaging. This technique involves investing a fixed amount of money on a regular basis, regardless of market conditions. This helped him to avoid the temptation to buy and sell based on emotional reactions to market fluctuations.
Slowly but surely, Chris' account balance started to grow. He was consistent in his approach, and his hard work paid off. Afterwards decided to reinvest any profits he made back into his portfolio, compounding his gains over time.
As his account balance grew, Chris became more and more excited. He knew he was on the right track and could achieve his goal. He continued to trade with discipline and patience, never losing sight of his end goal. With these strategies in place, Chris watched his portfolio grow.
He was patient, and over time, his $10 investment turned into $100, then $500, and eventually $1000.


Tony-Stark
·
--
**5 Cryptos That Could Turn $200 into $100,000 by the End of 2024**
Ever dreamt of turning a mere $200 into a life-altering $100,000? With the right crypto pick, 2024 could be your year. Here are five promising cryptos that might just help you strike gold before the year is out:
1. **Pepe Unchained ($PEPU):** Ready to break free from the pack? With an impressive $8.7 million raked in during its presale, $PEPU is poised to make waves. As it prepares to launch its own layer 2 chain, this token promises lightning-quick transactions and minimal fees—making it a hot contender for massive gains.
2. **Crypto All-Stars ($STARS):** Shoot for the moon with $STARS. This token is designed for big dreamers, offering unified staking across multiple chains and tokens. If you’re looking for colossal rewards, $STARS could be your ticket to astronomical returns.
3. **PlayDoge ($PLAY):** Why just play when you can win big? $PLAY is the P2E (Play-to-Earn) sensation that’s already pulled in over $6 million in its presale. With its competitive leaderboard rewards, your gaming skills could be the key to serious profits.
4. **The Meme Games ($MGMES):** Calling all meme lovers! $MGMES is more than just a token—it’s the official currency of meme game enthusiasts. With a 25% token boost for presale predictions that hit the mark, it’s a playful yet potentially profitable pick for those who know their memes.
5. **Shiba Shootout ($SHIBASHOOT):** Gear up for a Wild West showdown with $SHIBASHOOT. This P2E game lets you stake, play, and take your chances in the Lucky Lasso Lottery. If you’ve got a quick draw and a bit of luck, this adventure could pay off in a big way.
**Remember:** The crypto world is as wild as it is exciting. While the potential for massive returns is real, so are the risks. Do your research, stay informed, and make sure you’re ready for the ride. Who knows? These five cryptos might just be the golden ticket you’ve been waiting for.
Ever dreamt of turning a mere $200 into a life-altering $100,000? With the right crypto pick, 2024 could be your year. Here are five promising cryptos that might just help you strike gold before the year is out:
1. **Pepe Unchained ($PEPU):** Ready to break free from the pack? With an impressive $8.7 million raked in during its presale, $PEPU is poised to make waves. As it prepares to launch its own layer 2 chain, this token promises lightning-quick transactions and minimal fees—making it a hot contender for massive gains.
2. **Crypto All-Stars ($STARS):** Shoot for the moon with $STARS. This token is designed for big dreamers, offering unified staking across multiple chains and tokens. If you’re looking for colossal rewards, $STARS could be your ticket to astronomical returns.
3. **PlayDoge ($PLAY):** Why just play when you can win big? $PLAY is the P2E (Play-to-Earn) sensation that’s already pulled in over $6 million in its presale. With its competitive leaderboard rewards, your gaming skills could be the key to serious profits.
4. **The Meme Games ($MGMES):** Calling all meme lovers! $MGMES is more than just a token—it’s the official currency of meme game enthusiasts. With a 25% token boost for presale predictions that hit the mark, it’s a playful yet potentially profitable pick for those who know their memes.
5. **Shiba Shootout ($SHIBASHOOT):** Gear up for a Wild West showdown with $SHIBASHOOT. This P2E game lets you stake, play, and take your chances in the Lucky Lasso Lottery. If you’ve got a quick draw and a bit of luck, this adventure could pay off in a big way.
**Remember:** The crypto world is as wild as it is exciting. While the potential for massive returns is real, so are the risks. Do your research, stay informed, and make sure you’re ready for the ride. Who knows? These five cryptos might just be the golden ticket you’ve been waiting for.
Log in to explore more content