
dr_mt
4.1k Posts

dr_mt
High-Frequency Trader
5.5 Years
0 Following
14.1K+ Followers
15.9K+ Liked
Posts
All
Quotes
Videos
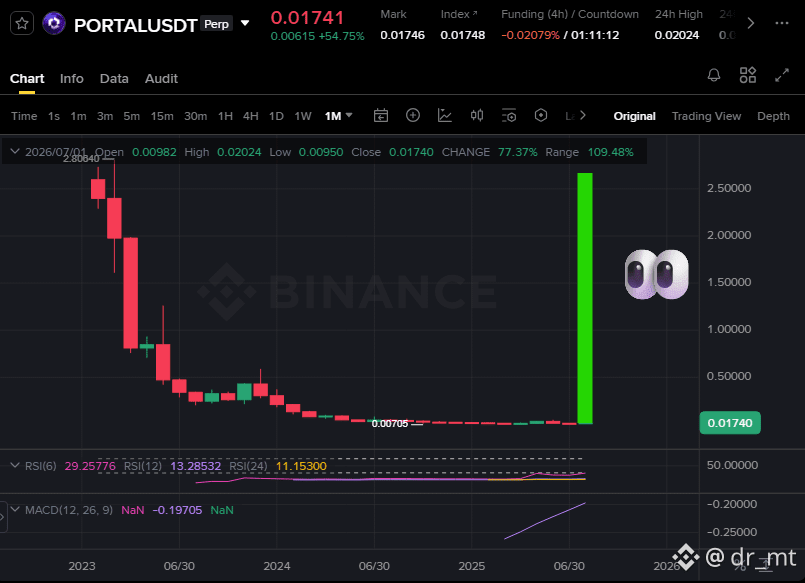
$PORTAL EXPLODES 💥🚀🚀🚀🚀🚀
It's going to be even better than AKE.
AI + Gaming = New Trend. ✨
Ride the wave now, and hold long term -
This Rally is just getting started.
Don't Miss out & Wait when price is already at $1.
Trade here 👇🤑
It's going to be even better than AKE.
AI + Gaming = New Trend. ✨
Ride the wave now, and hold long term -
This Rally is just getting started.
Don't Miss out & Wait when price is already at $1.
Trade here 👇🤑
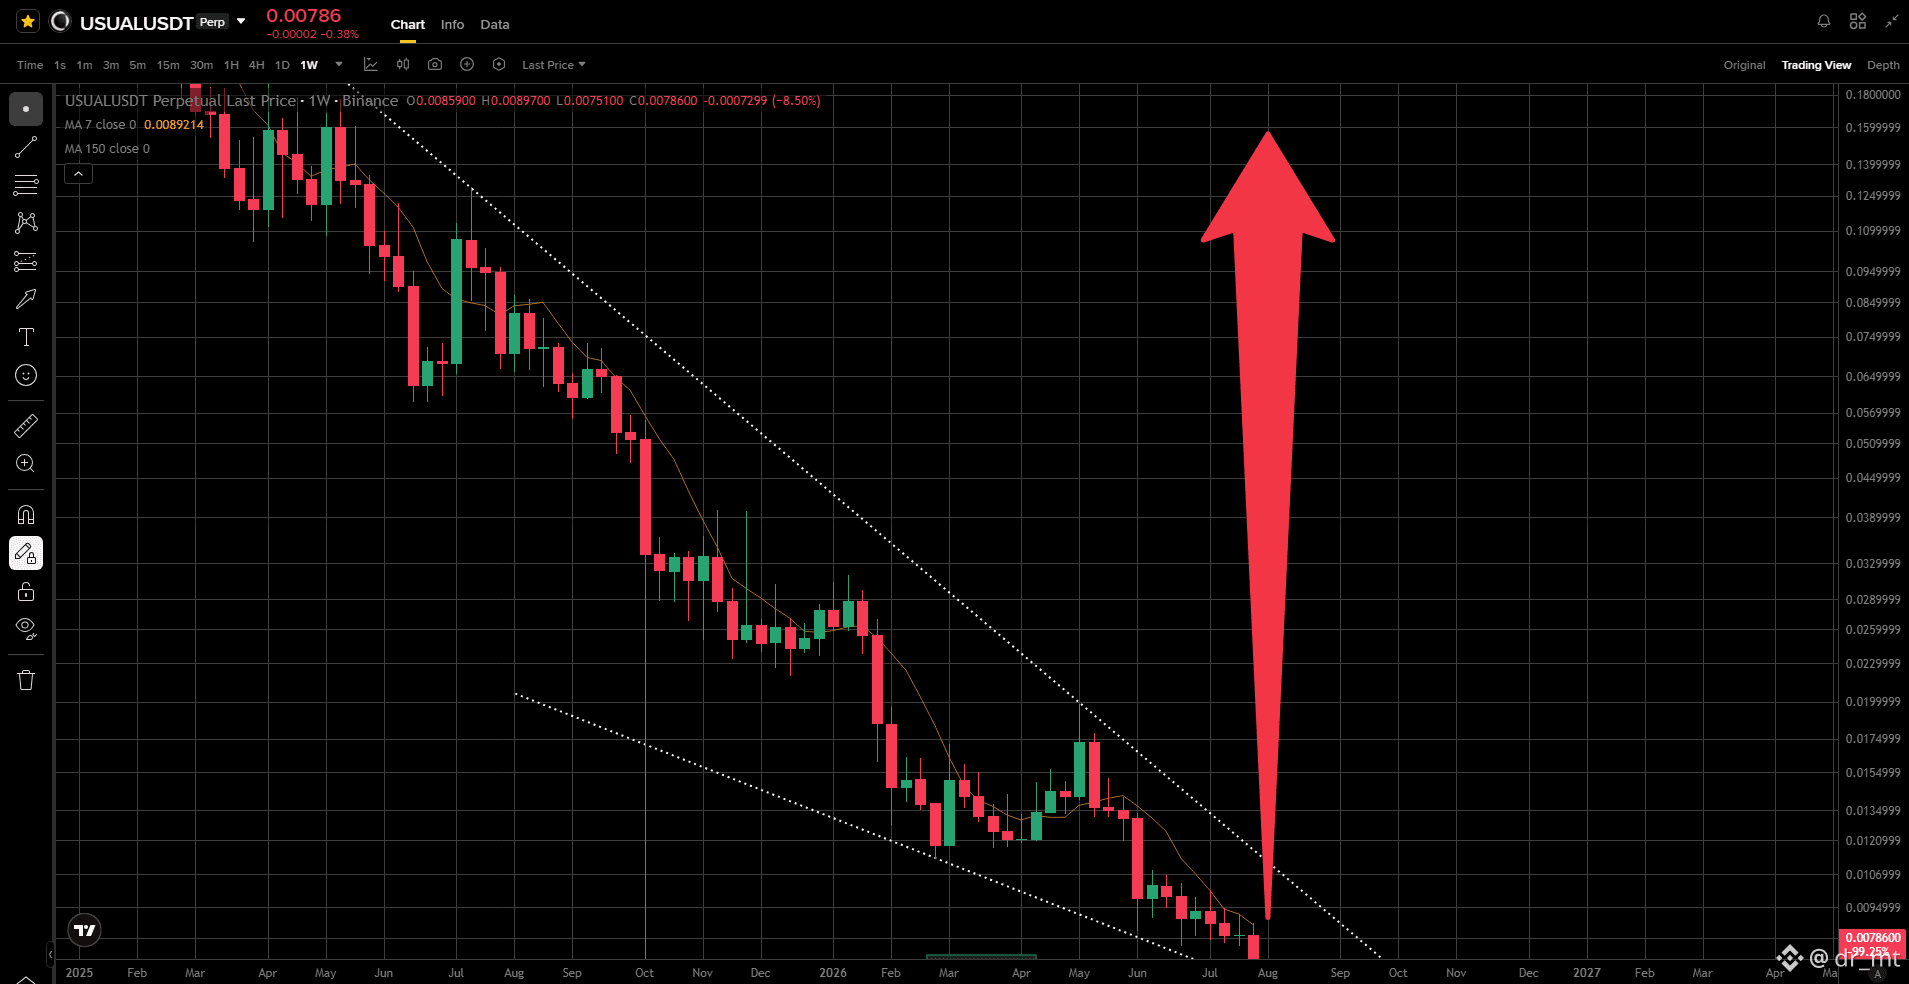
😘 Everyone just need to buy $USUAL now. 🤑
💥 Usual V2 officially launched on June 18, 2026 💥
👉Just MADE ATL now GOING To ATH🚀🚀🚀🎉
🚀Next Stop $1 then $2. 🚀
Big Rally Loading.. I can sense it. TBH.
#UsualForTheWin #MegaRally #bullish
💥 Usual V2 officially launched on June 18, 2026 💥
👉Just MADE ATL now GOING To ATH🚀🚀🚀🎉
🚀Next Stop $1 then $2. 🚀
Big Rally Loading.. I can sense it. TBH.
#UsualForTheWin #MegaRally #bullish
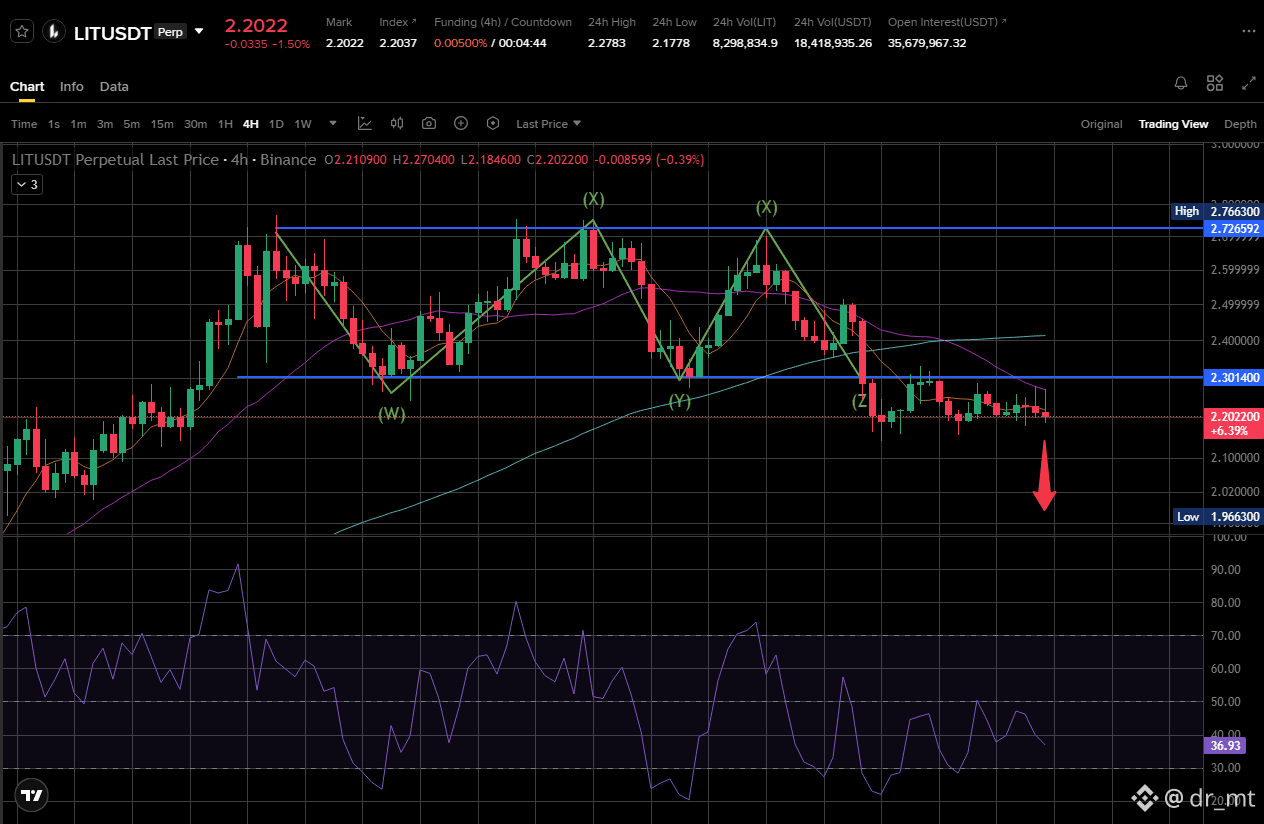
🚨 Triple Top Breakdown Confirmed... Is $LIT Headed for Another Leg Down? 📉
$LIT has officially broken below a triple top distribution structure, one of the strongest bearish reversal patterns in technical analysis. This type of breakdown often signals that buyers have exhausted their momentum while sellers are beginning to take control, increasing the probability of a sustained move lower if support continues to give way.
On the 4H timeframe, price is now trading below key resistance after repeatedly failing to reclaim higher levels. Every bounce has been weaker than the last, creating a series of lower highs that reflects fading bullish strength. The recent consolidation beneath resistance also resembles a bearish continuation pattern, suggesting this may simply be a pause before the next impulsive move downward.
RSI remains below the neutral zone, showing that bullish momentum is still lacking. Unless buyers can quickly reclaim the nearby resistance area around 2.30, the path of least resistance continues to favor the bears.
The next major downside level to watch sits near 1.96, which could become the next magnet if selling pressure accelerates. A clean break below the current consolidation zone would likely trigger another wave of bearish momentum toward that support.
⚠️ Keep this $LIT on your watchlist. A confirmed breakdown could present another high-probability move, while any failed bearish attempt and reclaim above resistance would invalidate this outlook.
Always wait for confirmation and manage your risk accordingly.
$LIT has officially broken below a triple top distribution structure, one of the strongest bearish reversal patterns in technical analysis. This type of breakdown often signals that buyers have exhausted their momentum while sellers are beginning to take control, increasing the probability of a sustained move lower if support continues to give way.
On the 4H timeframe, price is now trading below key resistance after repeatedly failing to reclaim higher levels. Every bounce has been weaker than the last, creating a series of lower highs that reflects fading bullish strength. The recent consolidation beneath resistance also resembles a bearish continuation pattern, suggesting this may simply be a pause before the next impulsive move downward.
RSI remains below the neutral zone, showing that bullish momentum is still lacking. Unless buyers can quickly reclaim the nearby resistance area around 2.30, the path of least resistance continues to favor the bears.
The next major downside level to watch sits near 1.96, which could become the next magnet if selling pressure accelerates. A clean break below the current consolidation zone would likely trigger another wave of bearish momentum toward that support.
⚠️ Keep this $LIT on your watchlist. A confirmed breakdown could present another high-probability move, while any failed bearish attempt and reclaim above resistance would invalidate this outlook.
Always wait for confirmation and manage your risk accordingly.
🏆 Spain Are World Champions!
Spain have defeated Argentina 1-0 after extra time to lift the 2026 FIFA World Cup, ending Argentina's hopes of back-to-back titles. $B
⚽ Ferran Torres delivered the decisive goal in the 106th minute, capping off a dominant Spanish performance. Despite Lionel Messi's relentless fight until the final whistle, Argentina struggled to create chances and finished the match with 10 men. $BANK
A new generation led by stars like Lamine Yamal has officially arrived, and Spain once again sit on top of world football. $TLM
Congratulations to Spain on an unforgettable World Cup triumph! 👏🔥
#FootballSeason2026 #SpainBeatsArgentina #WorldCupPredictionMarkets
Spain have defeated Argentina 1-0 after extra time to lift the 2026 FIFA World Cup, ending Argentina's hopes of back-to-back titles. $B
⚽ Ferran Torres delivered the decisive goal in the 106th minute, capping off a dominant Spanish performance. Despite Lionel Messi's relentless fight until the final whistle, Argentina struggled to create chances and finished the match with 10 men. $BANK
A new generation led by stars like Lamine Yamal has officially arrived, and Spain once again sit on top of world football. $TLM
Congratulations to Spain on an unforgettable World Cup triumph! 👏🔥
#FootballSeason2026 #SpainBeatsArgentina #WorldCupPredictionMarkets

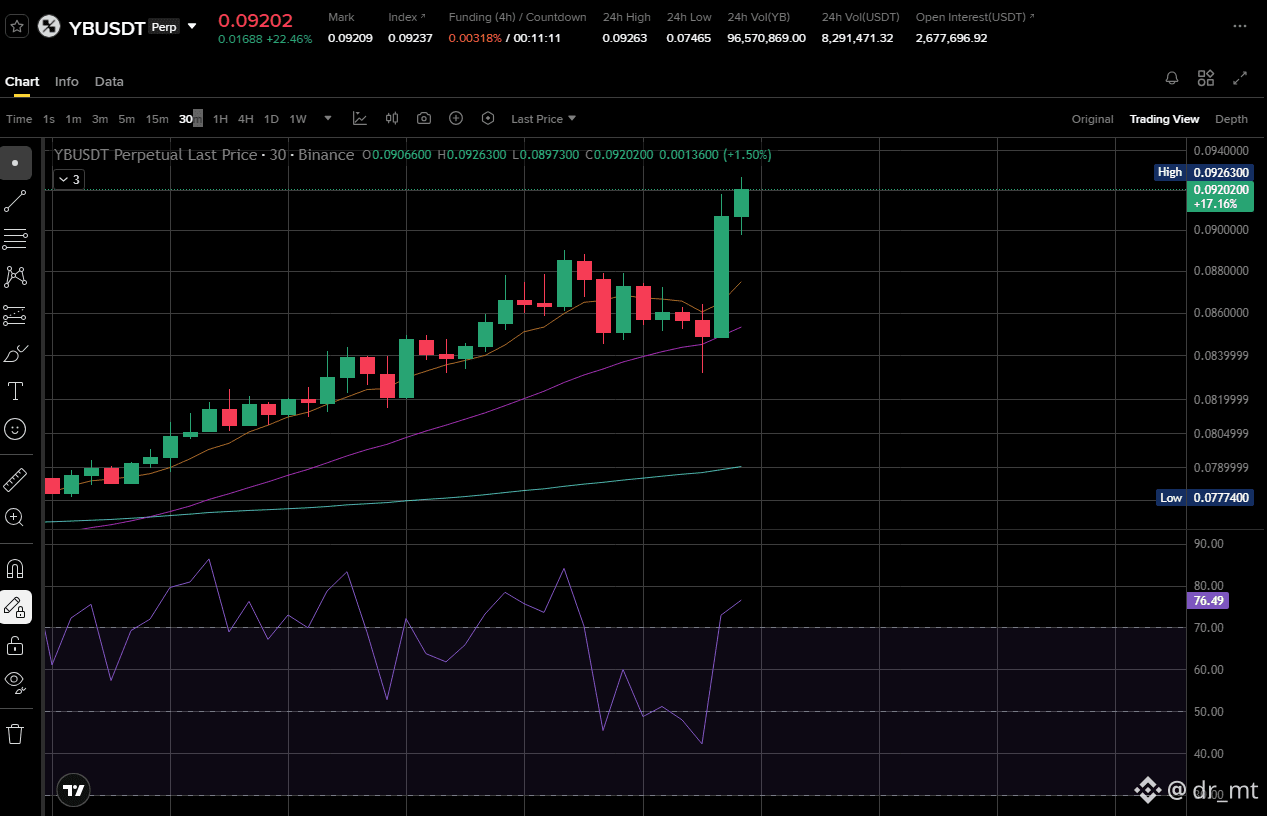
🚨 $YB Just Printed a Strong Breakout — But Can Bulls Hold It? 🚨
$YB has exploded through resistance with strong
bullish momentum, extending its uptrend
and printing fresh local highs.
The sharp expansion in price shows buyers are firmly
in control, while the moving averages
continue to slope upward,
reinforcing the strength of the current trend.
However, momentum is beginning to reach
stretched levels.
With RSI climbing into the mid-70s,
the asset is entering overbought territory.
While an overbought RSI doesn't
automatically signal a reversal,
it often suggests that the rally may
slow down or experience a short-term
pullback as traders begin locking in profits.
The key level to watch now is the
recent breakout zone.
If bulls can defend it as new support,
the breakout remains valid and the trend
could continue pushing toward even higher highs.
Strong volume on any retest would
further strengthen the bullish outlook.
As long as price continues making
higher highs and higher lows,
the overall structure remains bullish.
Traders should watch for either
a successful retest to add confidence
to the trend or signs of bearish divergence
and weakening momentum
before expecting a deeper correction.
Momentum is clearly on the bulls' side,
but after such a strong move,
confirmation is always better than chasing.
DYOR
Follow me
dr_mt
$YB
$YB has exploded through resistance with strong
bullish momentum, extending its uptrend
and printing fresh local highs.
The sharp expansion in price shows buyers are firmly
in control, while the moving averages
continue to slope upward,
reinforcing the strength of the current trend.
However, momentum is beginning to reach
stretched levels.
With RSI climbing into the mid-70s,
the asset is entering overbought territory.
While an overbought RSI doesn't
automatically signal a reversal,
it often suggests that the rally may
slow down or experience a short-term
pullback as traders begin locking in profits.
The key level to watch now is the
recent breakout zone.
If bulls can defend it as new support,
the breakout remains valid and the trend
could continue pushing toward even higher highs.
Strong volume on any retest would
further strengthen the bullish outlook.
As long as price continues making
higher highs and higher lows,
the overall structure remains bullish.
Traders should watch for either
a successful retest to add confidence
to the trend or signs of bearish divergence
and weakening momentum
before expecting a deeper correction.
Momentum is clearly on the bulls' side,
but after such a strong move,
confirmation is always better than chasing.
DYOR
Follow me
dr_mt
$YB
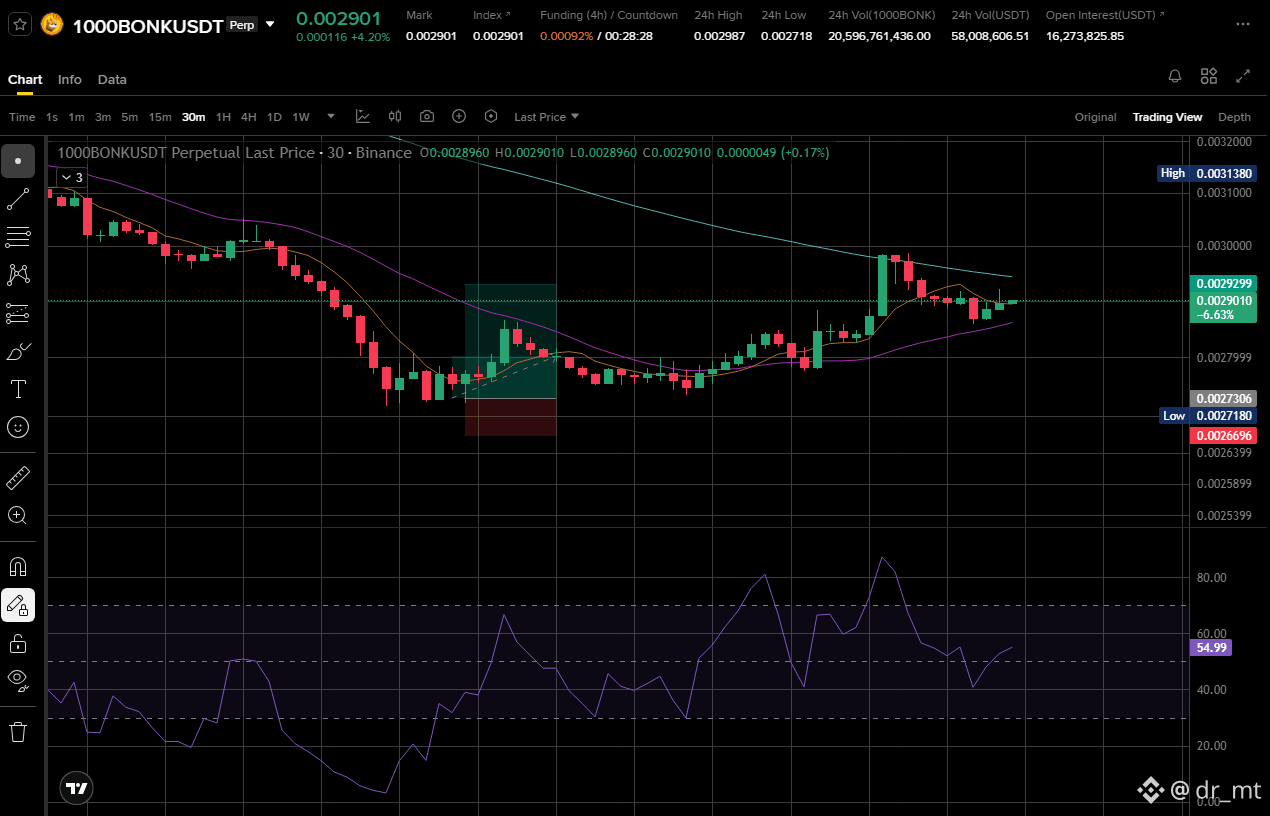
🎉🏆 CONGRATULATIONS, BONK HOLDERS! 🏆🎉
Every single take-profit target has now been smashed on our $1000BONK setup! 🚀
✅ TP1 Hit
✅ TP2 Hit
✅ TP3 Hit
✅ TP4 Hit
From spotting an extremely oversold RSI
at major support to a complete relief rally,
the setup played out exactly as anticipated.
A huge congratulations to everyone
who trusted the analysis, managed risk,
and stayed patient.
This is why waiting for high-probability
setups always beats chasing pumps.
More quality opportunities are on the way.
Stay tuned, stay disciplined,
and let's keep stacking those wins! 🔥📈
DYOR
Follow me
@dr_mt
Every single take-profit target has now been smashed on our $1000BONK setup! 🚀
✅ TP1 Hit
✅ TP2 Hit
✅ TP3 Hit
✅ TP4 Hit
From spotting an extremely oversold RSI
at major support to a complete relief rally,
the setup played out exactly as anticipated.
A huge congratulations to everyone
who trusted the analysis, managed risk,
and stayed patient.
This is why waiting for high-probability
setups always beats chasing pumps.
More quality opportunities are on the way.
Stay tuned, stay disciplined,
and let's keep stacking those wins! 🔥📈
DYOR
Follow me
@dr_mt
dr_mt
·
--
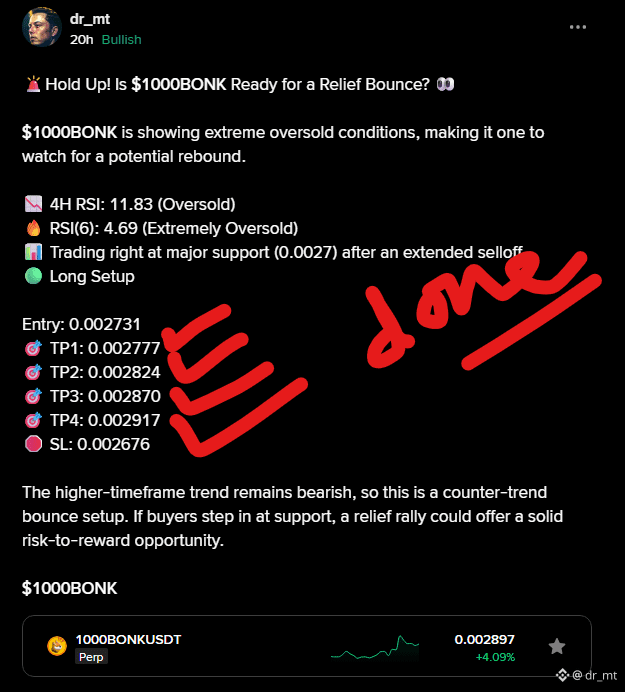
Bullish🚨Hold Up! Is $1000BONK Ready for a Relief Bounce? 👀
$1000BONK is showing extreme oversold conditions, making it one to watch for a potential rebound.
📉 4H RSI: 11.83 (Oversold)
🔥 RSI(6): 4.69 (Extremely Oversold)
📊 Trading right at major support (0.0027) after an extended selloff.
🟢 Long Setup
Entry: 0.002731
🎯 TP1: 0.002777
🎯 TP2: 0.002824
🎯 TP3: 0.002870
🎯 TP4: 0.002917
🛑 SL: 0.002676
The higher-timeframe trend remains bearish, so this is a counter-trend bounce setup. If buyers step in at support, a relief rally could offer a solid risk-to-reward opportunity.
$1000BONK
$1000BONK is showing extreme oversold conditions, making it one to watch for a potential rebound.
📉 4H RSI: 11.83 (Oversold)
🔥 RSI(6): 4.69 (Extremely Oversold)
📊 Trading right at major support (0.0027) after an extended selloff.
🟢 Long Setup
Entry: 0.002731
🎯 TP1: 0.002777
🎯 TP2: 0.002824
🎯 TP3: 0.002870
🎯 TP4: 0.002917
🛑 SL: 0.002676
The higher-timeframe trend remains bearish, so this is a counter-trend bounce setup. If buyers step in at support, a relief rally could offer a solid risk-to-reward opportunity.
$1000BONK
🚨🔥 TODAY'S BIGGEST PUMPERS ARE HERE! 🔥🚨
The market is seeing explosive momentum today,
led by $BANK (+159%), followed by $TLM (+84%)
and $B (+53%).
Several other altcoins including
ARIA, TAG, AKE, ONO, ZEREBRO, $YB, and KGEN
are also posting impressive double-digit gains.
While traders continue chasing the strongest performers,
one metric stands out from the crowd...
⚠️ $ESPORTS is showing a -2.00% funding rate.
An extremely negative funding rate means shorts
are paying a hefty premium to maintain their positions.
If buying pressure starts building,
this creates the potential conditions
for a short squeeze, where aggressive short
covering can accelerate price higher.
Keep these movers on your watchlist.
Momentum is clearly flowing into select altcoins,
and funding imbalances could
create the next explosive move. 🚀
DYOR
Follow me
dr_mt
The market is seeing explosive momentum today,
led by $BANK (+159%), followed by $TLM (+84%)
and $B (+53%).
Several other altcoins including
ARIA, TAG, AKE, ONO, ZEREBRO, $YB, and KGEN
are also posting impressive double-digit gains.
While traders continue chasing the strongest performers,
one metric stands out from the crowd...
⚠️ $ESPORTS is showing a -2.00% funding rate.
An extremely negative funding rate means shorts
are paying a hefty premium to maintain their positions.
If buying pressure starts building,
this creates the potential conditions
for a short squeeze, where aggressive short
covering can accelerate price higher.
Keep these movers on your watchlist.
Momentum is clearly flowing into select altcoins,
and funding imbalances could
create the next explosive move. 🚀
DYOR
Follow me
dr_mt
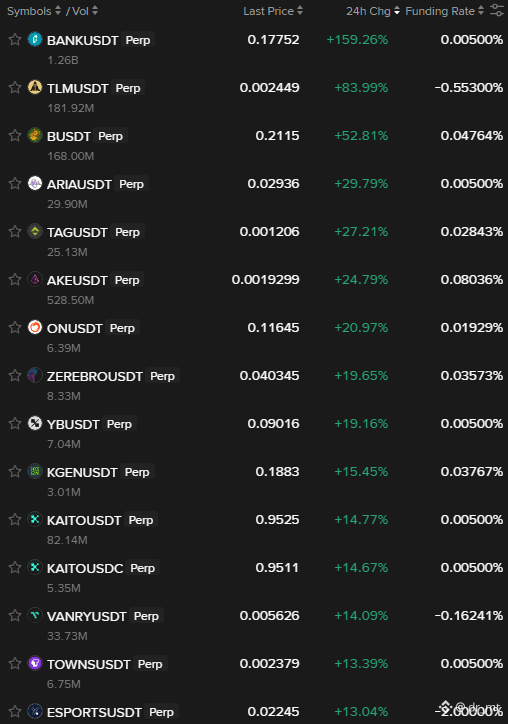
🚨😱 MAJOR REJECTION ALERT! 😱🚨
$ARIA just faced a sharp rejection after
attempting to push higher, printing a bearish
Marubozu candlestick on the 30-minute timeframe.
This is an early warning that sellers have
stepped in aggressively, increasing
the chances of a deeper pullback
if buyers fail to reclaim the recent high.
For now, caution is warranted.
Watch how price reacts around support
before expecting another leg higher.
$ARIA
$ARIA just faced a sharp rejection after
attempting to push higher, printing a bearish
Marubozu candlestick on the 30-minute timeframe.
This is an early warning that sellers have
stepped in aggressively, increasing
the chances of a deeper pullback
if buyers fail to reclaim the recent high.
For now, caution is warranted.
Watch how price reacts around support
before expecting another leg higher.
$ARIA
⚠️ $AKE May Have Entered Distribution – Bulls Need to Defend Key Levels ⚠️
$AKE has broken its bullish trendline,
which is often the first warning that momentum is fading.
Rather than continuing its strong uptrend,
price now appears to be entering
a possible distribution phase,
where larger market participants may gradually
be offloading positions while retail
traders continue buying.
This doesn't guarantee a major decline,
but it does signal that the market structure
deserves much closer attention.
A confirmed rejection from current levels
followed by lower highs and lower lows
would strengthen the bearish case.
If sellers continue to absorb buying pressure,
the next move could be a retest of
lower support zones, with the highlighted
support area becoming the most important
level to watch. Losing that support would
likely accelerate downside momentum as
more traders begin locking in profits.
On the other hand, distribution is only a
possibility until price confirms it.
If buyers reclaim the broken trendline
and push above recent swing highs with
strong volume, the bearish outlook would
weaken significantly and the
uptrend could resume.
For now, this is a market that calls for
patience rather than aggression.
The trend has already shown signs of weakening,
and the next few candles will likely determine
whether this is simply a healthy consolidation
or the beginning of a larger corrective move.
Watch price action closely and
let confirmation—not emotion—guide your next trade.
DYOR
Follow me
dr_mt
$AKE
$AKE has broken its bullish trendline,
which is often the first warning that momentum is fading.
Rather than continuing its strong uptrend,
price now appears to be entering
a possible distribution phase,
where larger market participants may gradually
be offloading positions while retail
traders continue buying.
This doesn't guarantee a major decline,
but it does signal that the market structure
deserves much closer attention.
A confirmed rejection from current levels
followed by lower highs and lower lows
would strengthen the bearish case.
If sellers continue to absorb buying pressure,
the next move could be a retest of
lower support zones, with the highlighted
support area becoming the most important
level to watch. Losing that support would
likely accelerate downside momentum as
more traders begin locking in profits.
On the other hand, distribution is only a
possibility until price confirms it.
If buyers reclaim the broken trendline
and push above recent swing highs with
strong volume, the bearish outlook would
weaken significantly and the
uptrend could resume.
For now, this is a market that calls for
patience rather than aggression.
The trend has already shown signs of weakening,
and the next few candles will likely determine
whether this is simply a healthy consolidation
or the beginning of a larger corrective move.
Watch price action closely and
let confirmation—not emotion—guide your next trade.
DYOR
Follow me
dr_mt
$AKE
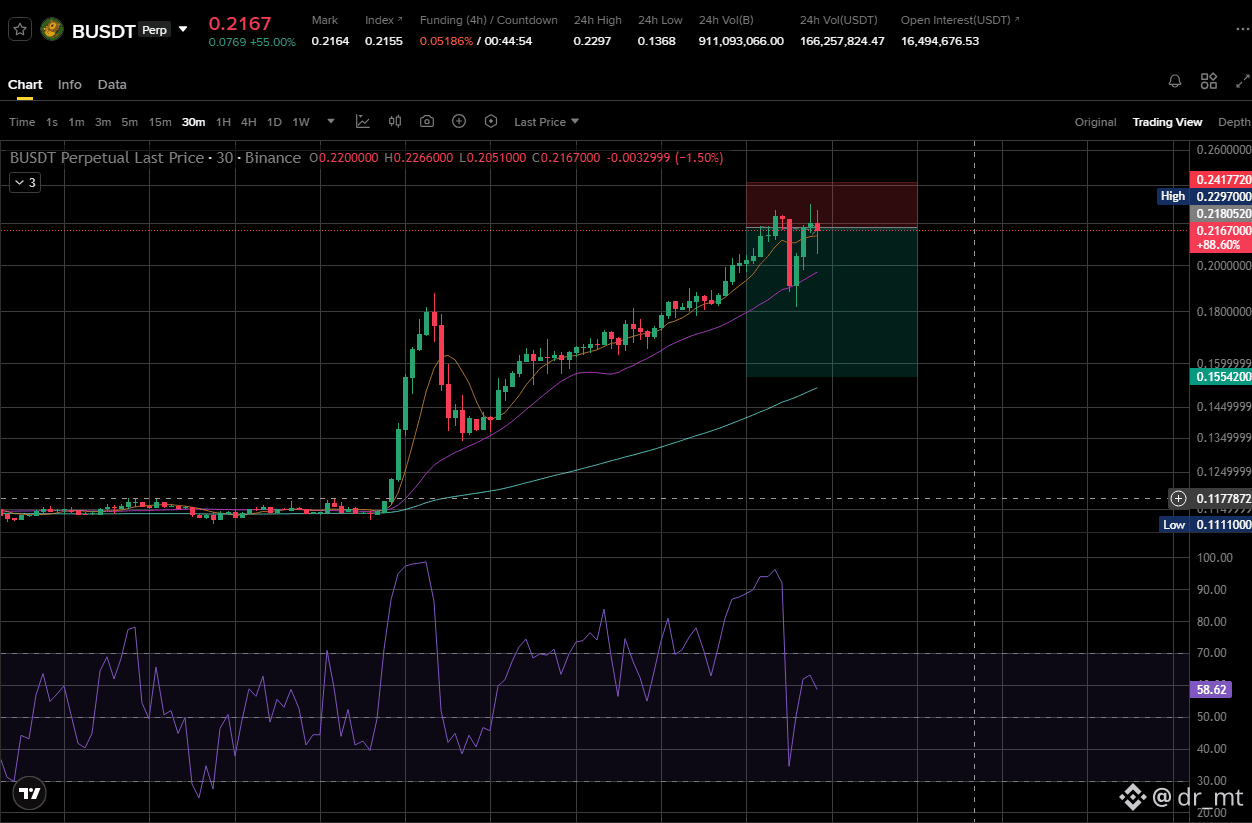
⚠️ Double Top Alert on $B ? Watch $0.19 Carefully ⚠️
$B is approaching a critical technical level.
If price breaks below the $0.19 support,
it could begin confirming a double top formation,
one of the market's most recognized bearish
reversal patterns.
After such a powerful rally, this would be the
first meaningful sign that buyers are losing
control and that a deeper correction may be ahead.
A confirmed break beneath $0.19 would
likely trigger increased profit-taking from
short-term traders while inviting fresh bearish
momentum into the market.
The neckline breakdown would invalidate
the recent higher-high structure and
shift sentiment toward a more defensive
outlook, with price potentially retracing
toward lower support zones before
finding renewed demand.
For now, the bulls are still holding the line,
and the pattern remains unconfirmed.
As long as $0.19 continues to act as support,
the uptrend remains intact and buyers still
have a chance to invalidate the bearish
setup by pushing to new highs.
This is one of those levels that deserves
close attention.
If $0.19 gives way with convincing volume,
the technical picture could change quickly.
Patience is key, wait for confirmation rather
than anticipating the move,
and let price reveal its next direction
before committing to a position.
$B
$B is approaching a critical technical level.
If price breaks below the $0.19 support,
it could begin confirming a double top formation,
one of the market's most recognized bearish
reversal patterns.
After such a powerful rally, this would be the
first meaningful sign that buyers are losing
control and that a deeper correction may be ahead.
A confirmed break beneath $0.19 would
likely trigger increased profit-taking from
short-term traders while inviting fresh bearish
momentum into the market.
The neckline breakdown would invalidate
the recent higher-high structure and
shift sentiment toward a more defensive
outlook, with price potentially retracing
toward lower support zones before
finding renewed demand.
For now, the bulls are still holding the line,
and the pattern remains unconfirmed.
As long as $0.19 continues to act as support,
the uptrend remains intact and buyers still
have a chance to invalidate the bearish
setup by pushing to new highs.
This is one of those levels that deserves
close attention.
If $0.19 gives way with convincing volume,
the technical picture could change quickly.
Patience is key, wait for confirmation rather
than anticipating the move,
and let price reveal its next direction
before committing to a position.
$B
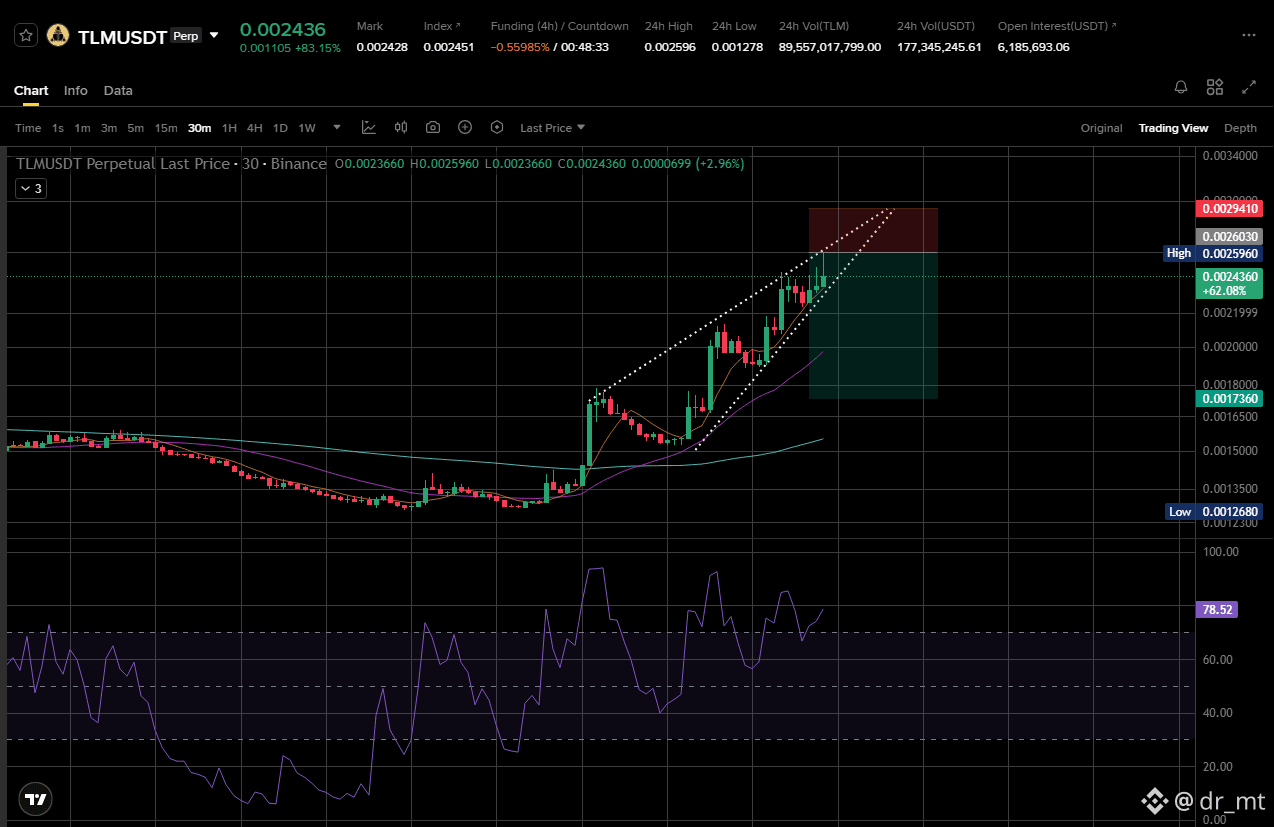
⚠️ Rising Wedge Breakdown Could Change Everything for $TLM ⚠️
Keep a close eye on $TLM here. 👀
The price is currently trading inside a rising wedge,
a pattern that often signals weakening bullish momentum
as buyers continue pushing higher
with diminishing strength.
While the trend remains intact for now,
a bearish breakdown below the lower trendline
would be the first major warning that the recent
rally is running out of steam.
If that breakdown is confirmed with strong selling
volume, expect profit-taking to accelerate
as late buyers begin exiting their positions.
The first downside target would likely be the
previous support zone, with a deeper
retracement possible if bears maintain control.
After such a strong move, a healthy correction
would not be unusual before the next major trend develops.
That said, confirmation is everything.
A rising wedge is only valid once price decisively
closes below support.
Until then, the uptrend remains alive,
and traders should avoid anticipating
the breakdown too early.
Watch the lower trendline closely.
If it fails, momentum could shift quickly
from bullish to bearish, creating opportunities
for both short-term traders and those waiting
to re-enter at lower levels.
Stay patient, let the market confirm the move,
and always manage your risk.
$TLM
Keep a close eye on $TLM here. 👀
The price is currently trading inside a rising wedge,
a pattern that often signals weakening bullish momentum
as buyers continue pushing higher
with diminishing strength.
While the trend remains intact for now,
a bearish breakdown below the lower trendline
would be the first major warning that the recent
rally is running out of steam.
If that breakdown is confirmed with strong selling
volume, expect profit-taking to accelerate
as late buyers begin exiting their positions.
The first downside target would likely be the
previous support zone, with a deeper
retracement possible if bears maintain control.
After such a strong move, a healthy correction
would not be unusual before the next major trend develops.
That said, confirmation is everything.
A rising wedge is only valid once price decisively
closes below support.
Until then, the uptrend remains alive,
and traders should avoid anticipating
the breakdown too early.
Watch the lower trendline closely.
If it fails, momentum could shift quickly
from bullish to bearish, creating opportunities
for both short-term traders and those waiting
to re-enter at lower levels.
Stay patient, let the market confirm the move,
and always manage your risk.
$TLM
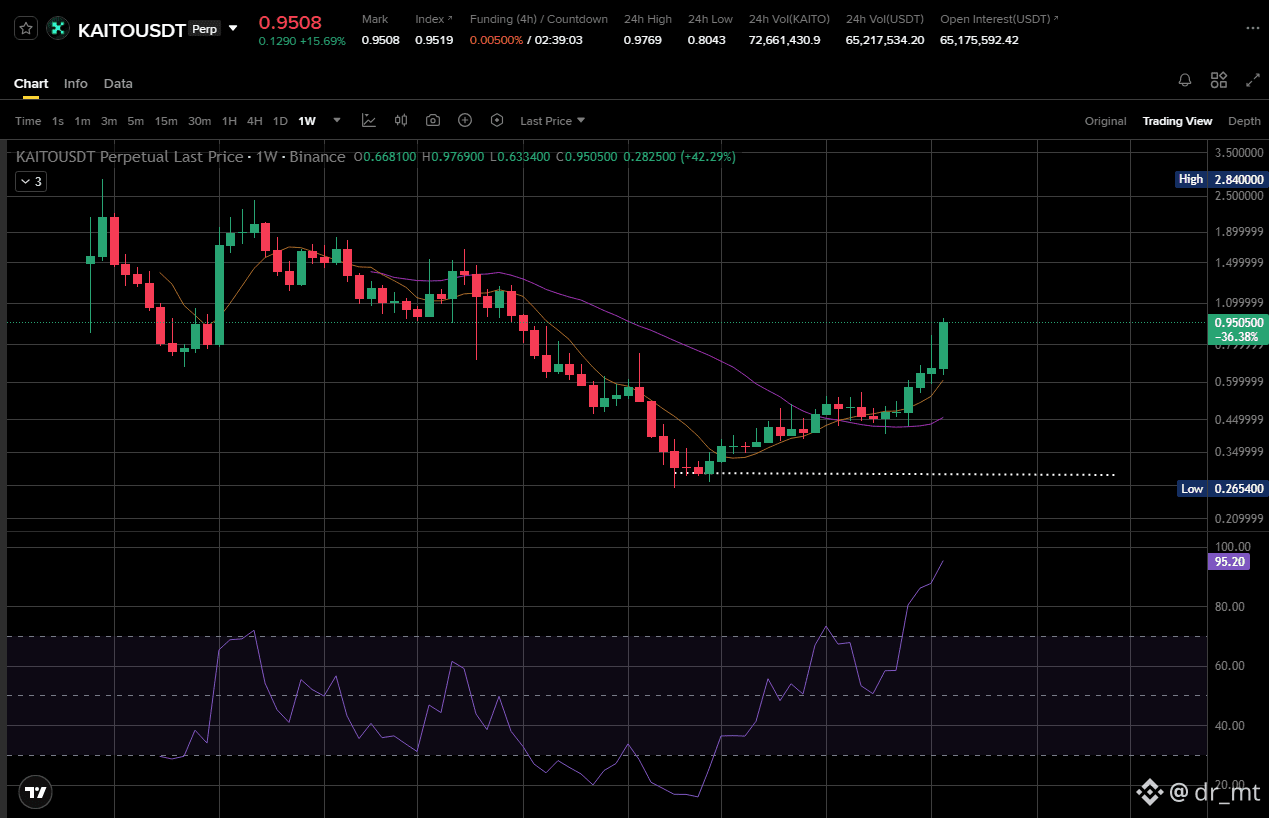
🚨 $KAITO Is Approaching A Major Technical Breakout
While most traders are chasing short-term moves,
$KAITO is testing one of the most important resistance
levels on the weekly chart.
After spending months trading inside a descending
channel, price has rallied back to the upper trendline
that has rejected every major bounce throughout
the downtrend.
A confirmed weekly breakout above this level
would invalidate the long-term bearish structure
and could mark the beginning of a new bullish trend.
Multi-month channel breakouts often lead to
explosive momentum as buyers gain confidence
and short sellers are forced to cover their positions.
Momentum is already showing impressive strength.
RSI(6) has climbed above 95, reflecting exceptional
buying pressure. While many view an overbought
RSI as bearish, strong trends can remain overbought
for extended periods as price continues
pushing higher. In many cases, this is a sign of
strength rather than weakness.
The overall market structure has also improved
significantly. Buyers have defended higher lows,
reclaimed key moving averages,
and selling pressure appears to be fading
after each rally.
That shift suggests accumulation may be
replacing distribution, a healthy sign for
longer-term continuation.
That said, the descending channel remains
resistance until it's broken.
A short-term pullback or consolidation would
be completely normal after such a strong run.
However, if bulls can secure a convincing weekly
close above the trendline, the probability of
a sustained move higher increases dramatically.
The next few weekly candles could define the
direction for months to come.
Keep $KAITO on your watchlist—this is one of the
cleanest long-term breakout setups
developing in the market right now. 🚀📈
While most traders are chasing short-term moves,
$KAITO is testing one of the most important resistance
levels on the weekly chart.
After spending months trading inside a descending
channel, price has rallied back to the upper trendline
that has rejected every major bounce throughout
the downtrend.
A confirmed weekly breakout above this level
would invalidate the long-term bearish structure
and could mark the beginning of a new bullish trend.
Multi-month channel breakouts often lead to
explosive momentum as buyers gain confidence
and short sellers are forced to cover their positions.
Momentum is already showing impressive strength.
RSI(6) has climbed above 95, reflecting exceptional
buying pressure. While many view an overbought
RSI as bearish, strong trends can remain overbought
for extended periods as price continues
pushing higher. In many cases, this is a sign of
strength rather than weakness.
The overall market structure has also improved
significantly. Buyers have defended higher lows,
reclaimed key moving averages,
and selling pressure appears to be fading
after each rally.
That shift suggests accumulation may be
replacing distribution, a healthy sign for
longer-term continuation.
That said, the descending channel remains
resistance until it's broken.
A short-term pullback or consolidation would
be completely normal after such a strong run.
However, if bulls can secure a convincing weekly
close above the trendline, the probability of
a sustained move higher increases dramatically.
The next few weekly candles could define the
direction for months to come.
Keep $KAITO on your watchlist—this is one of the
cleanest long-term breakout setups
developing in the market right now. 🚀📈
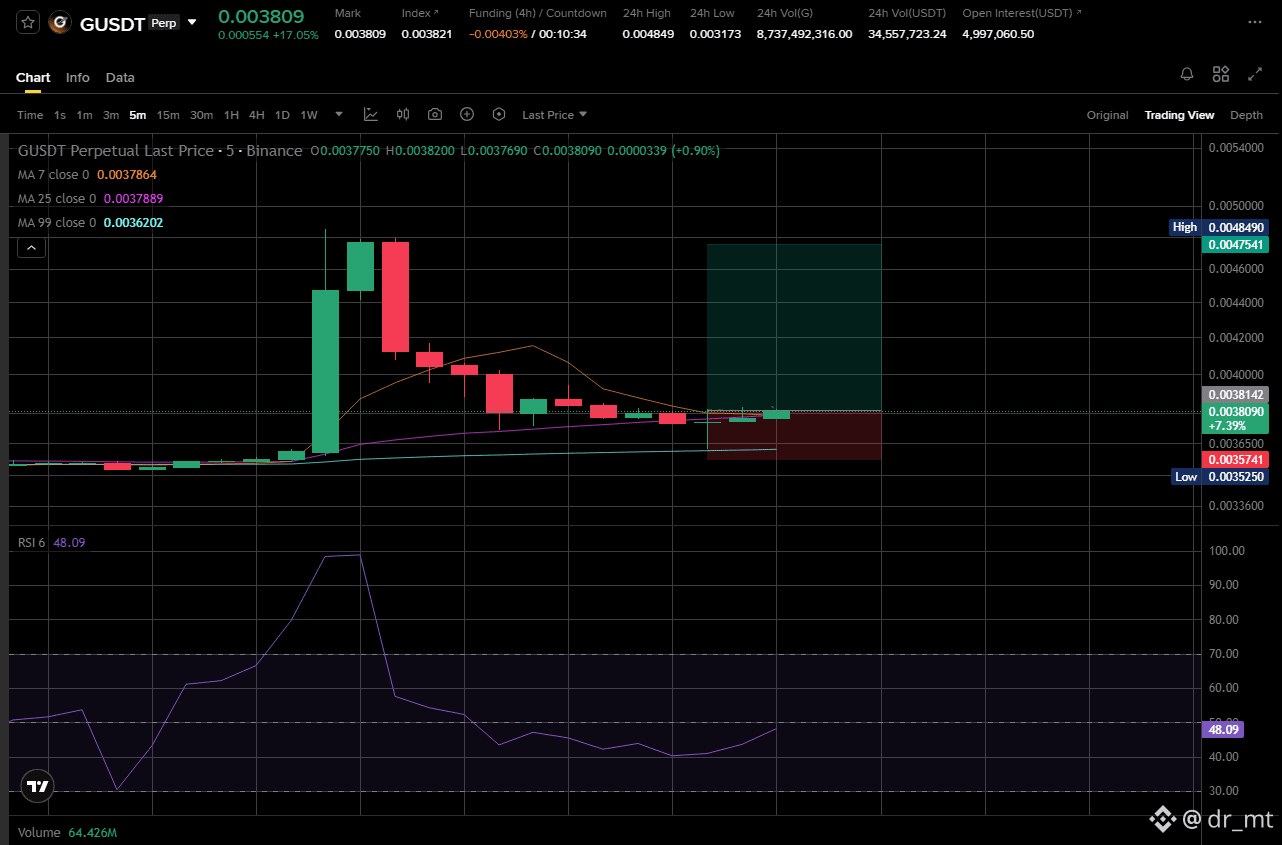
$G is on a pullback and will it continue its bullish rally?
Entry : Current price
TP : 0.0040, 0.0044 & 0.0047
SL : 0.0035-0.0037
$G
Entry : Current price
TP : 0.0040, 0.0044 & 0.0047
SL : 0.0035-0.0037
$G
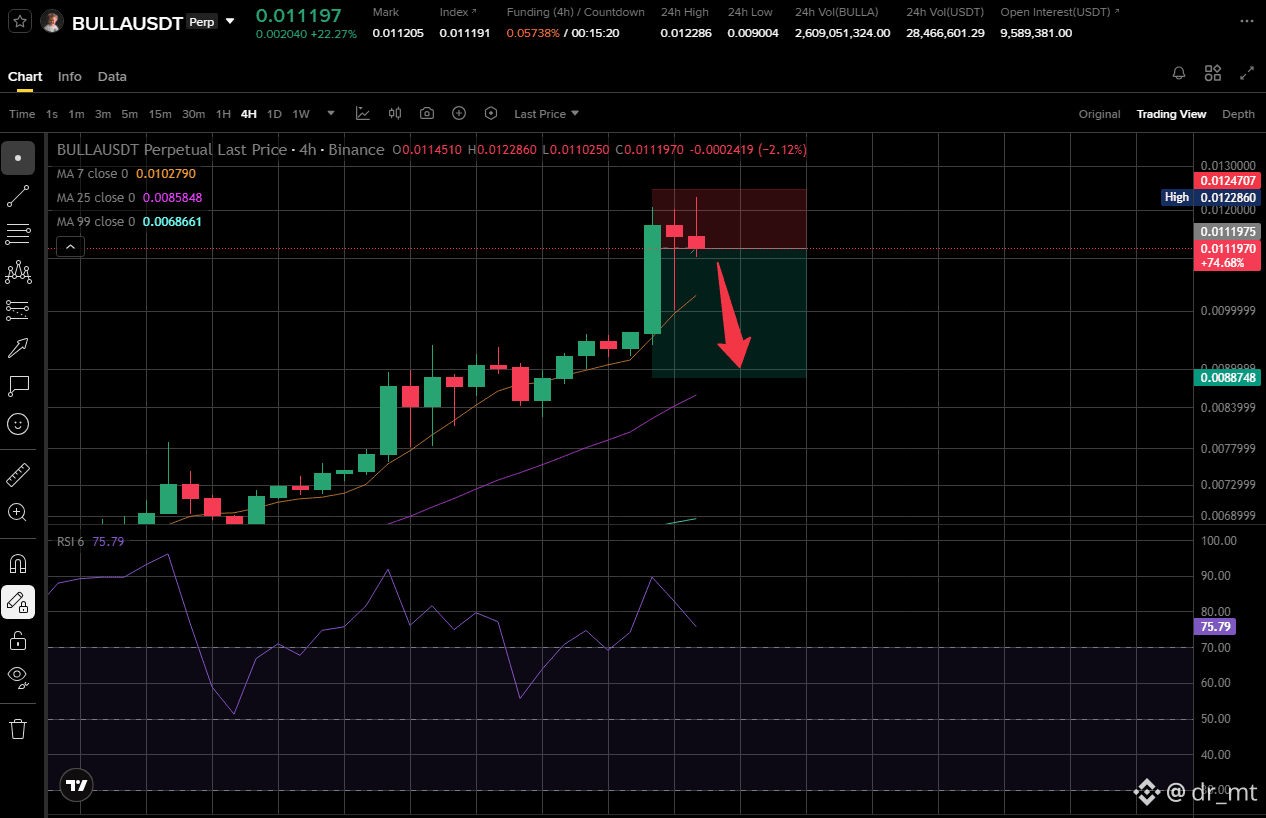
$BULLA Now Facing Rejection, it's time to short...
One the 4 hour time frame,
After a Marabuzo candlestick, next candle formed
hangman, indicating that buyers are starting to book their
profits and sentiments are fading away quickly. Then
after that current fake push to clean liquidity at 0.0123
level, price once again now taking a dip. Momentum
shift is now favoring the bears, so we can expect
a revisit to lower support at around 0.0089 to wipe
out some liquidation for next possible leg up.
$BULLA
One the 4 hour time frame,
After a Marabuzo candlestick, next candle formed
hangman, indicating that buyers are starting to book their
profits and sentiments are fading away quickly. Then
after that current fake push to clean liquidity at 0.0123
level, price once again now taking a dip. Momentum
shift is now favoring the bears, so we can expect
a revisit to lower support at around 0.0089 to wipe
out some liquidation for next possible leg up.
$BULLA
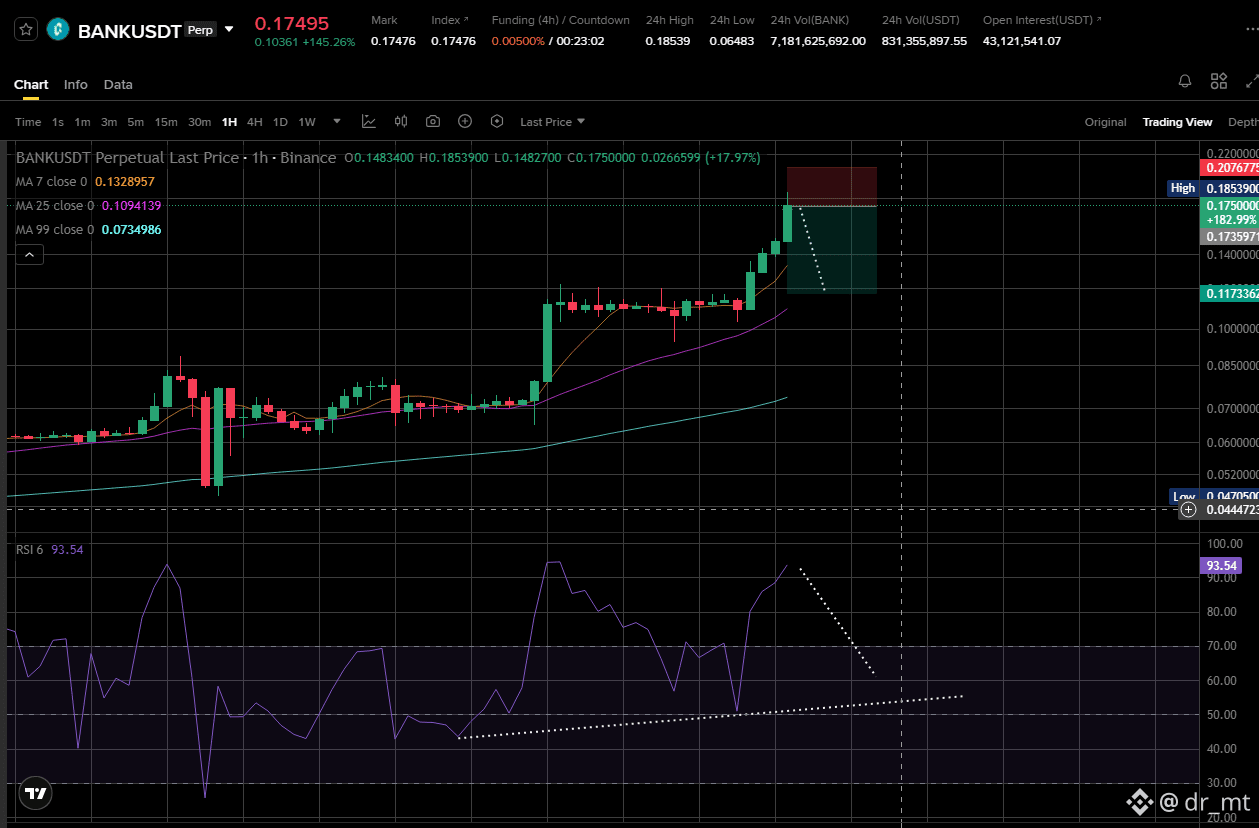
$BANK pullback ready.. It's ready to snapback any minute.
HERE'S WHY 👇👇👇👇
On all time frames, RSI is now in extreme overbought
condition. We can expect at least 50% pullback from a
24 hour move, that means towards 0.13 before next leg
higher. If you're thinking about buying at this level, it's
not a great idea because you may get stuck with
high priced asset. On 15 Min time frame RSI has already
started to take a dip as buyers are starting to book their
profits and unable to push further higher.
$BANK
HERE'S WHY 👇👇👇👇
On all time frames, RSI is now in extreme overbought
condition. We can expect at least 50% pullback from a
24 hour move, that means towards 0.13 before next leg
higher. If you're thinking about buying at this level, it's
not a great idea because you may get stuck with
high priced asset. On 15 Min time frame RSI has already
started to take a dip as buyers are starting to book their
profits and unable to push further higher.
$BANK
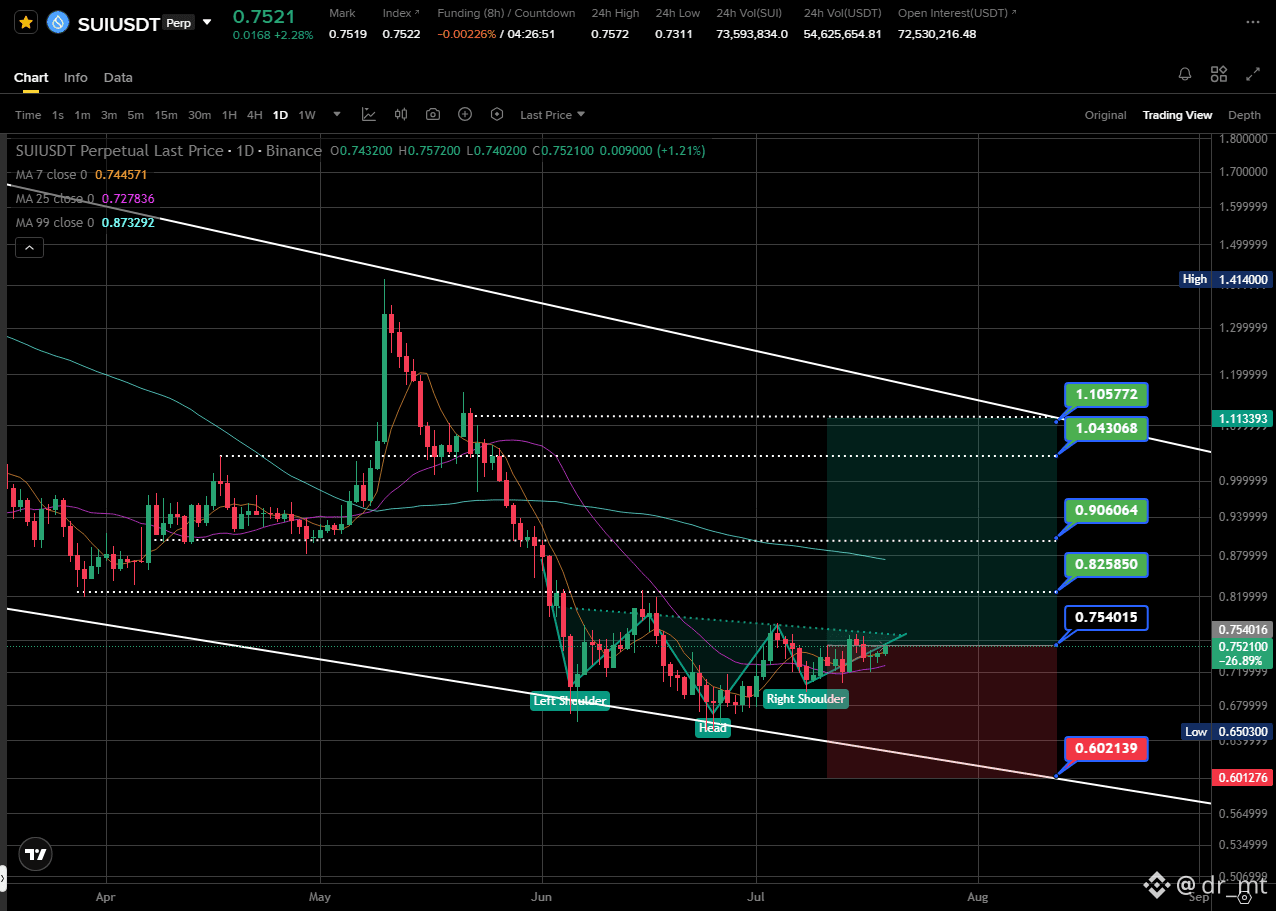
$SUI One Month target. Swing Trade.
Entry : Current price (accumulation phase)
Targets : 0.82, 0.90, 1.04 & 1.10
SL : 0.60
$SUI
Entry : Current price (accumulation phase)
Targets : 0.82, 0.90, 1.04 & 1.10
SL : 0.60
$SUI
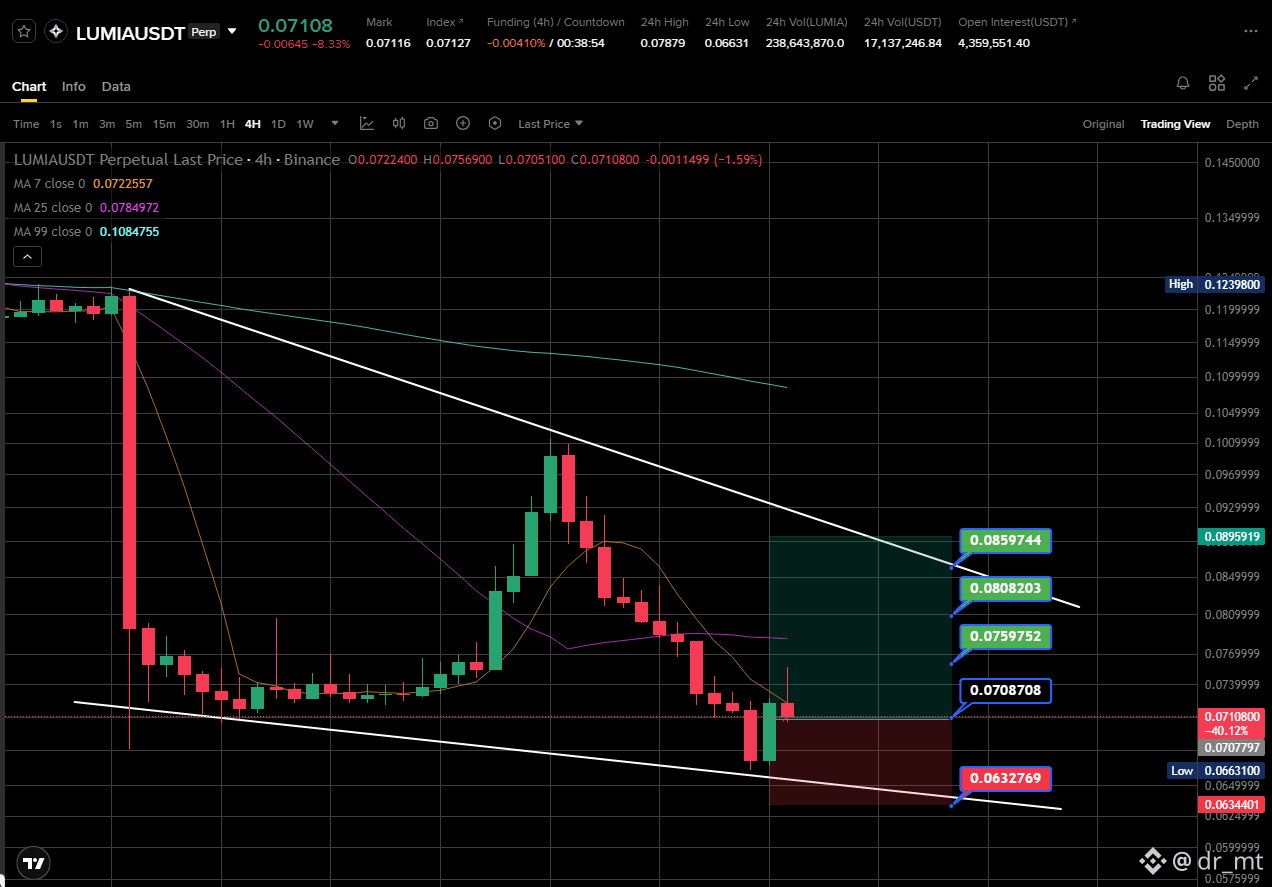
$LUMIA bulls are back in charge short term, here's why...
Price is now consolidating within forming falling wedge
chart pattern and it's now on the 2nd wave. On the 4HR
time frame it has also formed engulfing tweezer bottom
candlestick, which entails a reversal towards the above
structural resistance.
Long Trade Setup :
Entry : Current price (Pullback)
TP : 0.075, 0.080 & 0.085
SL : 0.063
$LUMIA
Price is now consolidating within forming falling wedge
chart pattern and it's now on the 2nd wave. On the 4HR
time frame it has also formed engulfing tweezer bottom
candlestick, which entails a reversal towards the above
structural resistance.
Long Trade Setup :
Entry : Current price (Pullback)
TP : 0.075, 0.080 & 0.085
SL : 0.063
$LUMIA
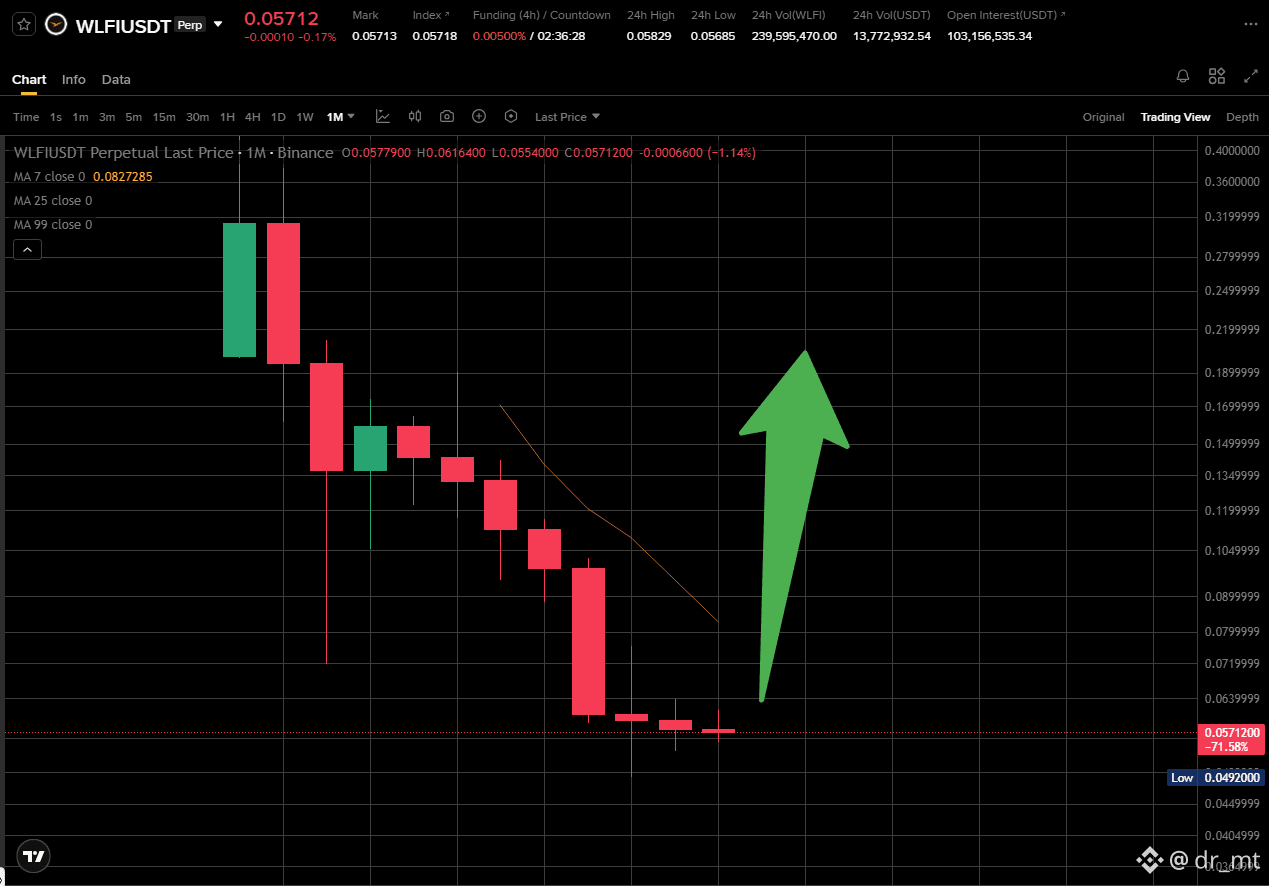
🚨 SMART MONEY IS WATCHING THIS ONE 🚨
$WLFI has gone through a brutal selloff...
But here's what stands out now:
📉 Selling pressure is fading.
The massive red candles have been replaced by much smaller ones, showing that bears are losing momentum.
This is often the phase where panic sellers are exhausted and accumulation begins before the next major move.
If buyers step in from these levels, the risk-to-reward becomes increasingly attractive compared to chasing after a breakout.
The biggest gains are usually made by those who position themselves before momentum returns—not after everyone starts talking about it.
👀 Keep $WLFI on your watchlist.
The chart is showing early signs that the downside is slowing, and if demand continues to build, the coming days or weeks could bring a significant upside move.
Patience. Accumulation. Then expansion. 📈
$WLFI
$WLFI has gone through a brutal selloff...
But here's what stands out now:
📉 Selling pressure is fading.
The massive red candles have been replaced by much smaller ones, showing that bears are losing momentum.
This is often the phase where panic sellers are exhausted and accumulation begins before the next major move.
If buyers step in from these levels, the risk-to-reward becomes increasingly attractive compared to chasing after a breakout.
The biggest gains are usually made by those who position themselves before momentum returns—not after everyone starts talking about it.
👀 Keep $WLFI on your watchlist.
The chart is showing early signs that the downside is slowing, and if demand continues to build, the coming days or weeks could bring a significant upside move.
Patience. Accumulation. Then expansion. 📈
$WLFI

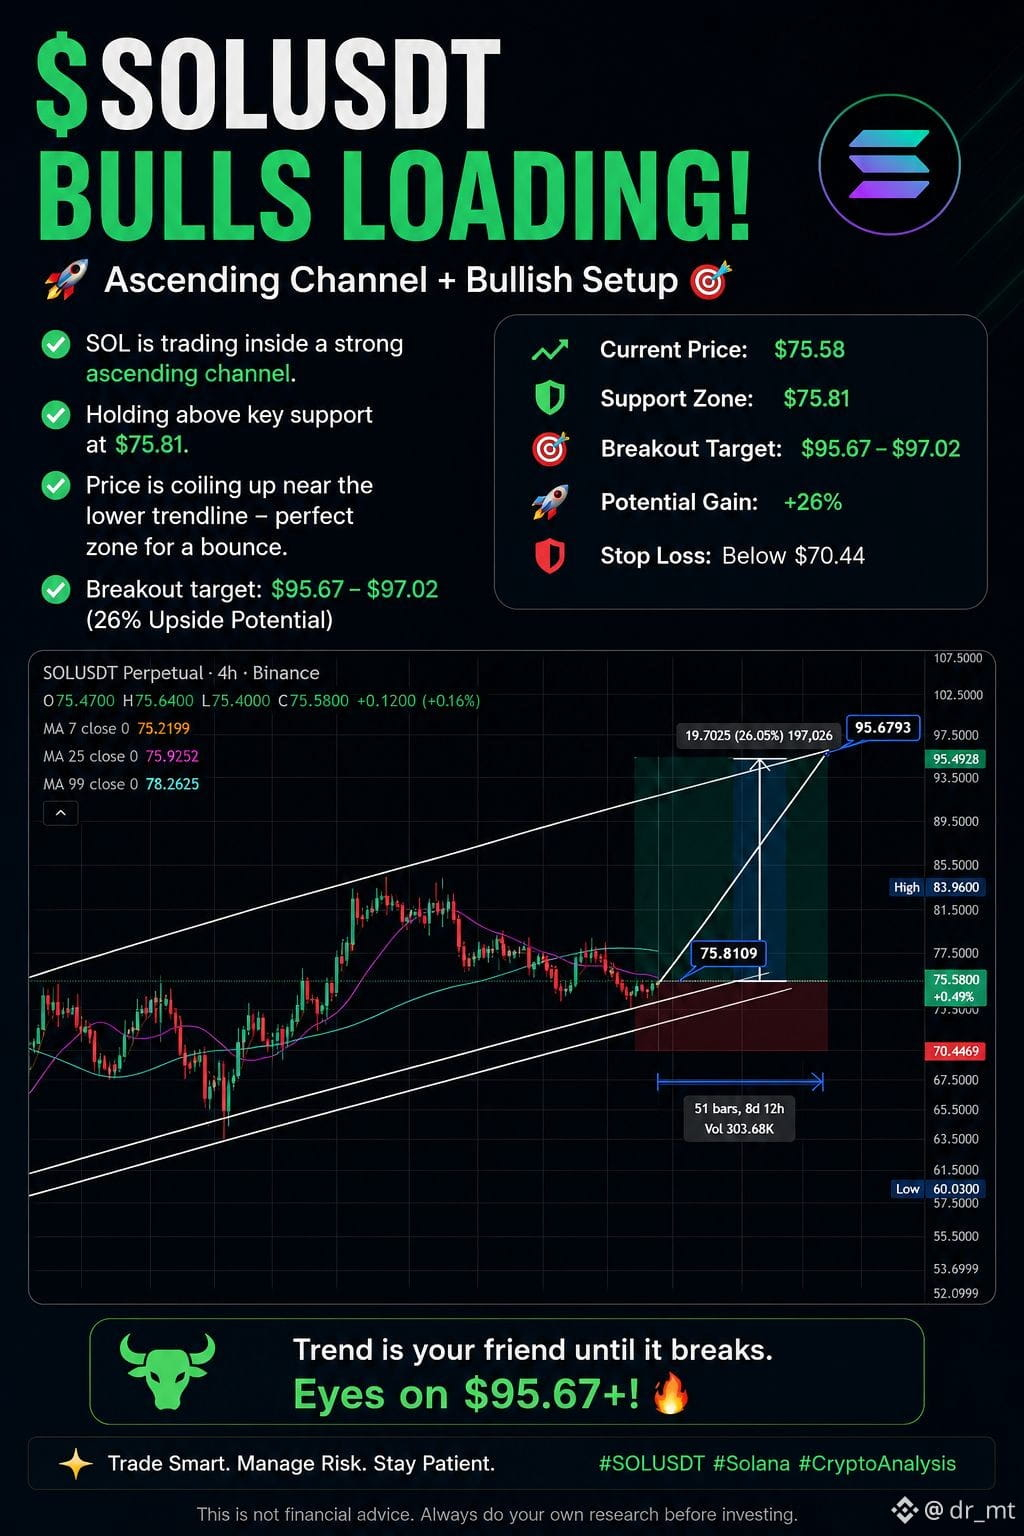
🚨 $SOL Is Setting Up For A Big Move 🚨
$SOL is respecting a rising trendline while trading inside a bullish ascending channel on the 4H chart.
The recent pullback has brought price back into a strong support zone, offering a favorable risk-to-reward setup for patient buyers.
📍 Current Support: $75.8
🎯 Bullish Target: $95.7 (+26%)
🛑 Invalidation: Below $70.4
⏱️ Hold Duration : 8-10 days
As long as support holds, this looks like a healthy retest rather than a trend reversal. A breakout from this structure could send SOL back toward the upper channel resistance.
Keep this one on your watchlist—risk is defined, and the upside remains attractive if bulls step in. 📈🔥
$SOL
#SOL #Crypto #binanc #Altcoins #Trading
$SOL is respecting a rising trendline while trading inside a bullish ascending channel on the 4H chart.
The recent pullback has brought price back into a strong support zone, offering a favorable risk-to-reward setup for patient buyers.
📍 Current Support: $75.8
🎯 Bullish Target: $95.7 (+26%)
🛑 Invalidation: Below $70.4
⏱️ Hold Duration : 8-10 days
As long as support holds, this looks like a healthy retest rather than a trend reversal. A breakout from this structure could send SOL back toward the upper channel resistance.
Keep this one on your watchlist—risk is defined, and the upside remains attractive if bulls step in. 📈🔥
$SOL
#SOL #Crypto #binanc #Altcoins #Trading
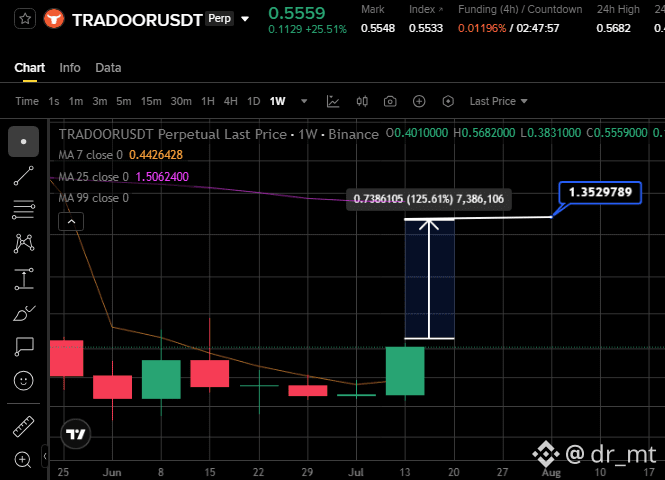
🚨 SPOT HOLDERS, DON'T IGNORE THIS 🚨
$TRADOOR is beginning to show a high-conviction weekly reversal, and this is exactly the kind of structure long-term spot investors look for.
📈 The chart is targeting a potential move toward $1.35, representing roughly a 125% upside from the current price if momentum continues.
Why this stands out:
• Weekly momentum is strengthening.
• Buyers are stepping back in after a prolonged decline.
• A sustained close above key resistance could trigger the next leg higher.
For spot holders, short-term volatility shouldn't be the focus. The weekly trend is what matters, and right now it's starting to shift in favor of the bulls.
$TRADOOR
$TRADOOR is beginning to show a high-conviction weekly reversal, and this is exactly the kind of structure long-term spot investors look for.
📈 The chart is targeting a potential move toward $1.35, representing roughly a 125% upside from the current price if momentum continues.
Why this stands out:
• Weekly momentum is strengthening.
• Buyers are stepping back in after a prolonged decline.
• A sustained close above key resistance could trigger the next leg higher.
For spot holders, short-term volatility shouldn't be the focus. The weekly trend is what matters, and right now it's starting to shift in favor of the bulls.
$TRADOOR
Log in to explore more content