
The Lower Highs and Lower Lows (LHLL) strategy is a popular approach used by traders to identify potential trend reversals in financial markets. By analyzing price patterns, traders can make informed decisions on when to enter or exit positions. This comprehensive guide will explain the LHLL strategy, its key concepts, and provide step-by-step instructions on how to apply it effectively.
Table of Contents:
I. Understanding the LHLL Strategy A. Definition and Purpose B. Basic Concepts C. Benefits and Limitations
II. Identifying Lower Highs and Lower Lows A. Definition and Characteristics B. Visual Representation
III. Applying the LHLL Strategy A. Timeframe Selection B. Chart Analysis 1. Identifying Lower Highs 2. Spotting Lower Lows C. Confirmation Indicators 1. Moving Averages 2. Oscillators D. Risk Management and Stop Loss Placement
IV. LHLL Strategy Trade Examples A. Bullish Reversal Scenario 1. Entry Point 2. Stop Loss Placement 3. Target Price Determination B. Bearish Reversal Scenario 1. Entry Point 2. Stop Loss Placement 3. Target Price Determination C. Real-World Trade Examples
V. Tips for Success with the LHLL Strategy A. Practice Patience and Discipline B. Combine with Other Indicators C. Consider Market Conditions D. Monitor Risk-to-Reward Ratios
VI. Conclusion
I. Understanding the LHLL Strategy
A. Definition and Purpose: The LHLL strategy focuses on identifying lower highs and lower lows in price patterns. It aims to capture potential trend reversals, allowing traders to enter or exit positions at advantageous points. By understanding this strategy, traders can make more informed decisions and improve their overall trading performance.
B. Basic Concepts:
Lower Highs: These occur when a recent price peak is lower than the previous peak. They indicate a potential weakening of bullish momentum and a possible trend reversal.
Lower Lows: These occur when a recent price trough is lower than the previous trough. They suggest a potential weakening of bearish momentum and a potential trend reversal.
C. Benefits and Limitations:
Benefits:
Provides a simple yet effective method for identifying trend reversals.
Can be applied to various financial markets, including stocks, forex, and commodities.
Helps traders capture potential profit opportunities in both bullish and bearish scenarios.
Limitations:
False signals can occur, leading to losses if not managed properly.
Relies on historical price data and does not take into account other fundamental or macroeconomic factors.
Requires careful analysis and confirmation indicators for optimal results.
II. Identifying Lower Highs and Lower Lows
A. Definition and Characteristics:
Lower Highs: A lower high is formed when a subsequent price peak is lower than the previous peak. It represents a possible shift in trend direction from bullish to bearish.
Lower Lows: A lower low occurs when a subsequent price trough is lower than the previous trough. It suggests a potential change in trend direction from bearish to bullish.
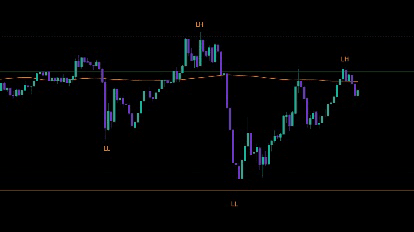
B. Visual Representation: 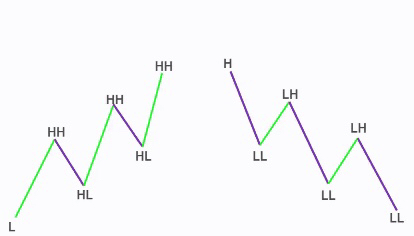 The LHLL pattern shows a sequence of declining peaks and troughs, indicating a potential trend reversal.
III. Applying the LHLL Strategy
A. Timeframe Selection:
Choose a timeframe that aligns with your trading goals and style. Shorter timeframes (e.g., intraday) may offer more frequent trading opportunities but require closer monitoring, while longer timeframes (e.g., daily or weekly) provide a broader perspective but fewer signals.
B. Chart Analysis:
Identifying Lower Highs:
Look for a peak in price that is lower than the previous peak.
Connect the lower highs with a trendline to visualize the downtrend.
Lower highs suggest weakening bullish momentum and a potential shift in sentiment.
Spotting Lower Lows:
Identify a trough in price that is lower than the previous trough.
Connect the lower lows with a trendline to visualize the downtrend.
Lower lows indicate diminishing bearish momentum and a potential trend reversal.
C. Confirmation Indicators:
Moving Averages:
Use moving averages (e.g., 50-day or 200-day) to confirm the LHLL pattern.
When the price is below the moving averages, it supports a bearish bias.
When the price crosses above the moving averages, it may signal a potential bullish reversal.
Oscillators:
Utilize oscillators (e.g., RSI, MACD, or Stochastic) to assess overbought or oversold conditions.
Overbought levels near lower highs strengthen the bearish case.
Oversold levels near lower lows reinforce the potential for a bullish reversal.
D. Risk Management and Stop Loss Placement:
Determine your risk tolerance and set a stop-loss order below the recent lower high or lower low, depending on your trading direction.
Adjust your position size to align with your risk management strategy, ensuring that potential losses are controlled.
IV. LHLL Strategy Trade Examples
A. Bullish Reversal Scenario:
Entry Point:
Wait for a higher low to form after the LHLL pattern.
Enter the trade when the price breaks above the trendline connecting the higher lows.
This breakout signifies a potential bullish reversal.
Stop Loss Placement:
Set a stop-loss order below the recent higher low to limit potential losses.
Consider the market volatility and adjust the stop-loss level accordingly.
Target Price Determination:
Identify resistance levels or previous swing highs as potential profit targets.
Use technical analysis tools like Fibonacci retracement or extension levels to pinpoint additional target areas.
B. Bearish Reversal Scenario:
Entry Point:
Wait for a lower high to form after the LHLL pattern.
Enter the trade when the price breaks below the trendline connecting the lower highs.
This breakdown indicates a potential bearish reversal.
Stop Loss Placement:
Set a stop-loss order above the recent lower high to manage risk.
Consider the market volatility and adjust the stop-loss level accordingly.
Target Price Determination:
Identify support levels or previous swing lows as potential profit targets.
Utilize technical analysis tools to determine additional target areas.
C. Real-World Trade Examples:
V. Tips for Success with the LHLL Strategy
A. Practice Patience and Discipline:
Wait for clear LHLL patterns to form before entering trades.
Avoid chasing trades orentering prematurely.
B. Combine with Other Indicators:
Enhance the LHLL strategy by using other technical indicators or chart patterns to validate trade signals.
Examples include trendlines, support/resistance levels, or candlestick patterns.
C. Consider Market Conditions:
Evaluate the overall market conditions, such as volatility, trend strength, and volume, to gauge the reliability of LHLL signals.
LHLL patterns tend to be more effective in trending markets than in range-bound or choppy markets.
D. Monitor Risk-to-Reward Ratios:
Calculate the potential reward versus the risk for each trade.
Aim for a favorable risk-to-reward ratio (e.g., 1:2 or higher) to ensure that potential profits outweigh potential losses.
VI. Conclusion
The Lower Highs and Lower Lows (LHLL) strategy provides traders with a powerful tool for identifying potential trend reversals. By analyzing price patterns and confirming signals with additional indicators, traders can make more informed trading decisions. Remember to practice risk management, be patient, and continuously evaluate market conditions to maximize the effectiveness of this strategy.