In the world of finance, trading patterns are an essential tool that traders use to analyze and understand the behavior of markets. Trading patterns are a reflection of market sentiment and can provide insights into where the market is headed. In this article, we will provide a comprehensive guide on trading patterns, listing down all the trading patterns, highlighting the most commonly used patterns, and discussing how traders can use these patterns to analyze market conditions.
What Are Trading Patterns?
Trading patterns refer to the recurring price movements and behavior of securities in the financial markets. These patterns are a reflection of market sentiment and provide insights into how traders perceive the value of a security. Traders use these patterns to analyze market conditions and make informed trading decisions.
List of Trading Patterns
There are numerous trading patterns that traders use to analyze market conditions. Here are some of the most commonly used patterns:
Trend
A trend refers to the general direction of the market. It can be either upward or downward, and traders use this pattern to determine the momentum of the market. A trend is considered bullish if it's moving upwards, and bearish if it's moving downwards.
Support and Resistance
Support and resistance levels are price points where the market has historically bounced off. A support level is where buyers are willing to purchase, and a resistance level is where sellers are willing to sell. Traders use these levels to set their entry and exit points for trades.
Moving Averages
Moving averages are a calculation of the average price of a security over a certain period of time. Traders use moving averages to identify whether a security is trending up or down.
Candlestick Patterns
Candlestick patterns are a visual representation of the high, low, opening, and closing prices of a security in a given time period. Traders use candlestick patterns to identify bullish or bearish trends, such as the hammer, shooting star, or doji.
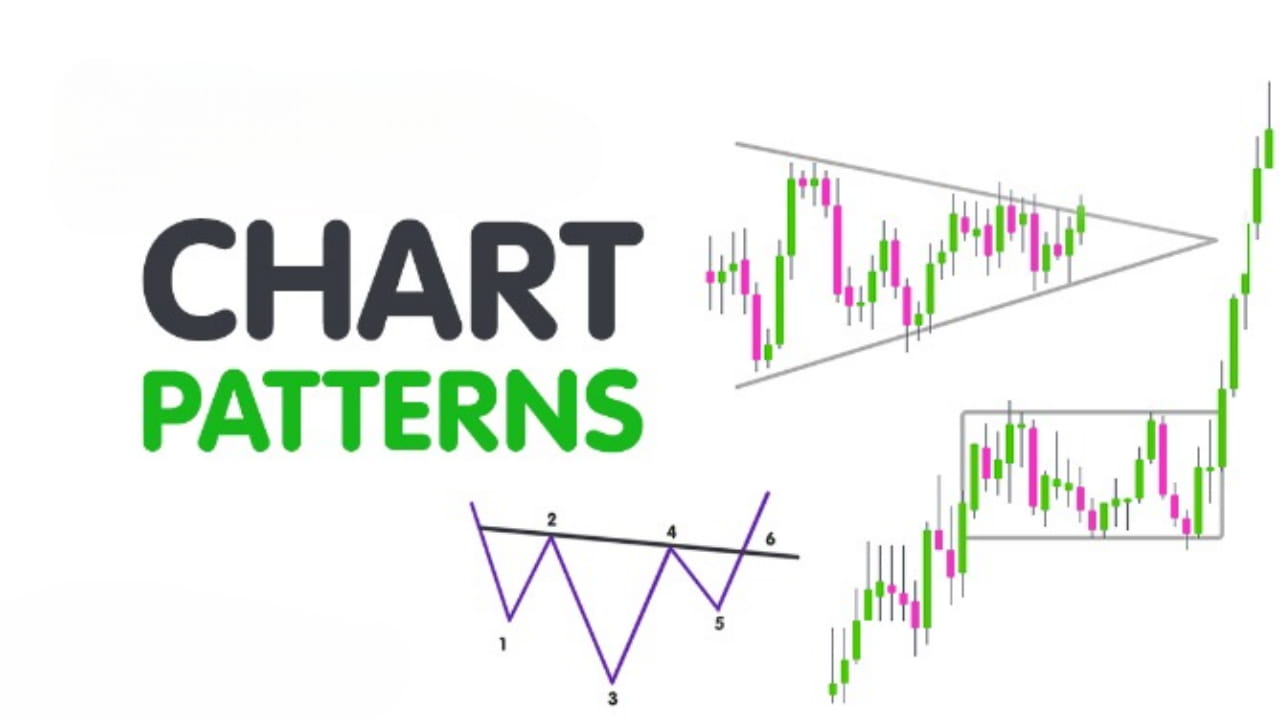
Chart Patterns
Chart patterns are formed when the price of security follows a particular formation. Examples of chart patterns include the head and shoulders pattern, the double top pattern, and the flag pattern.
How Traders Can Analyze the Condition of the Market by Using These Patterns
Traders can use trading patterns to analyze the condition of the market in the following ways:
Identify Trends
Trends are an essential component of trading patterns, and traders use them to identify the momentum of the market. By analyzing trends, traders can determine the general direction of the market and make informed trading decisions.
Set Entry and Exit Points
Support and resistance levels are crucial for setting entry and exit points for trades. Traders use these levels to determine when to buy or sell a security, which can help them maximize their profits and minimize their losses.
Identify Price Reversals
Candlestick patterns are a valuable tool for identifying price reversals. By analyzing candlestick patterns, traders can determine when a trend is about to reverse and make informed trading decisions.
Identify Market Trends
Chart patterns are a useful tool for identifying market trends. By analyzing chart patterns, traders can determine whether the market is in an uptrend, downtrend, or range-bound.
Conclusion
In conclusion, trading patterns are an essential tool for traders in the financial markets. They provide valuable insights into market sentiment and can help traders make informed trading decisions. By understanding the different trading patterns and how to use them to analyze market conditions, traders can gain an edge in the markets and increase their chances of success.