

Candlestick chart is the only chart type usable for trading and every trader should know how to read candles . Here are basic points to keep in mind when reading candlestick charts:
Each candle represents a certain time frame (e.g. one hour, one day, etc.), and contains information about the price action within that time period.
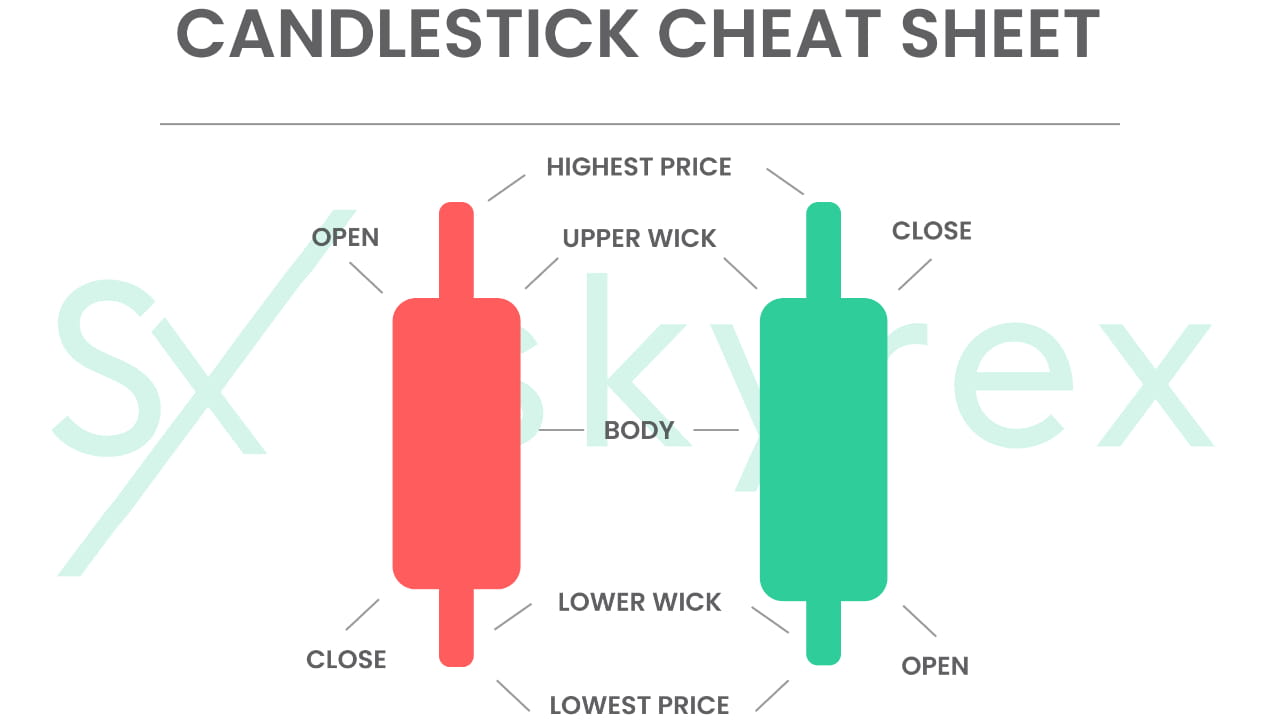
There are two types of candles: bullish (green) and bearish (red). Bullish candles indicate that the price went up during that time frame, while bearish candles indicate that the price went down.
The body of the candle represents the opening and closing prices during that time frame. The length of the body shows the difference between the opening and closing prices.
The wicks of the candle represent the highest and lowest prices reached during that time frame.
Patterns formed by a series of candles can provide insights into the market sentiment and potential price movements.
Candlestick charts can be used in conjunction with other technical indicators to help make more informed trading decisions.
Overall, reading candlestick charts takes some practice, but it essential tool for analyzing the market.
#dyor #crypto2023 #btc #Bitcoin