

Price Action
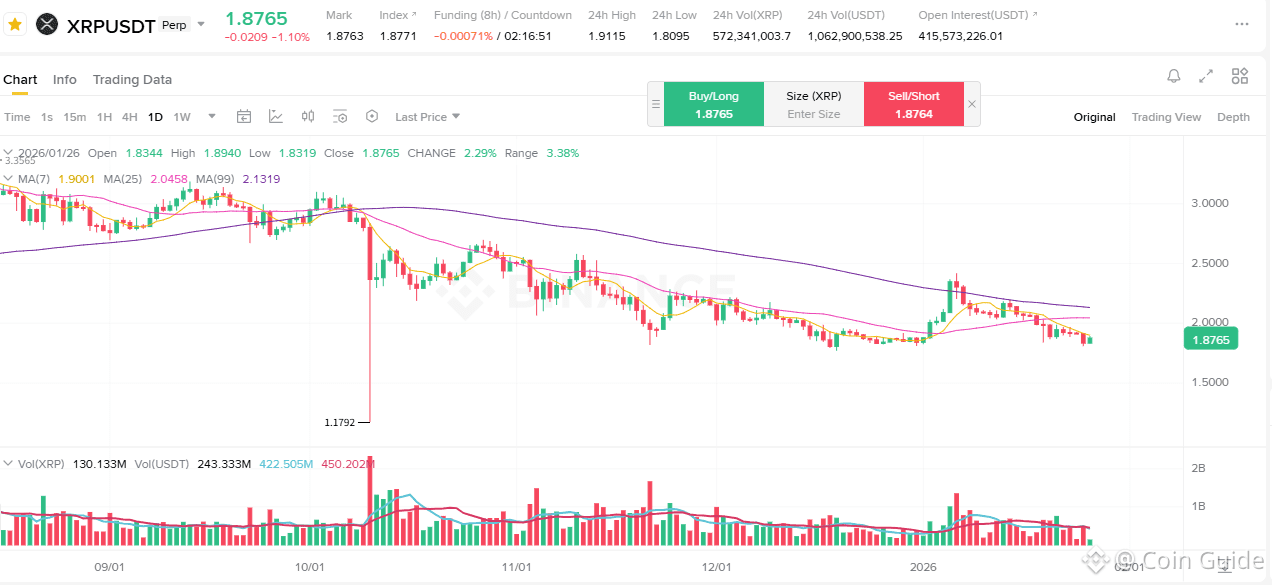
The current price is forming around $1.876.
On the daily chart, a structure of progressively lower highs and lower lows remains intact.
During a previous sharp sell-off, a long downside wick was formed near $1.17, followed by a rebound; however, price failed to recover prior highs.
Recent candles show limited volatility, with price action leaning toward consolidation after a gradual decline.
Moving Averages (MA7 · MA25 · MA99)
Price is currently trading below MA7, MA25, and MA99.
The short-term moving average (MA7) has crossed below the mid-term MA25 and continues to slope downward.
MA25 maintains a downward bias and is acting as near-term resistance.
MA99 functions as a long-term downward trend line, applying overhead pressure on price.
Volume
Trading volume spiked sharply during the earlier sell-off, then gradually declined.
In recent sessions, volume remains below average, indicating the absence of strong buyer or seller dominance.
This volume behavior suggests a post-decline consolidation and wait-and-see phase.
Price Structure
Although a rebound followed the sharp drop, subsequent highs failed to exceed previous peaks.
The sequence of lower highs and lower lows confirms that the downtrend structure has not yet been invalidated.
Recent recovery attempts have shown limited momentum, with price continuing to trade beneath the descending trend structure.
Technical Structure Summary (Fact-Based)
Downtrend remains intact on the daily chart.
Price is positioned below all major moving averages.
Rebound attempts have failed to reclaim previous highs.
Volume contraction indicates consolidation after decline.
Overall structure aligns with a post-downtrend correction phase rather than a trend reversal.