


📊 Summary of current situation
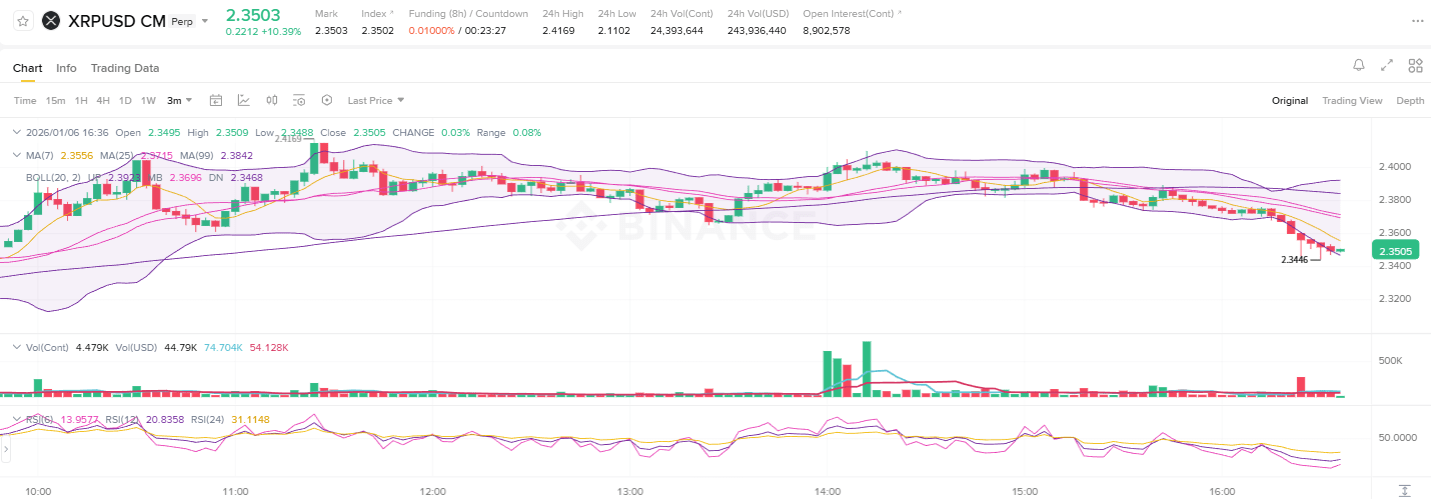
Current price: approximately 2.350
Recent high level: approximately 2.41~2.42
Movement summary:
Formation of higher levels after sequential gains → higher levels gradually declining in short-term decline
Market condition:
Rebound attempts are present, but buying strength is weak
👉 Currently, this is a zone to look for confirmation of support rather than expecting a strong bounce.
📉 Moving average (MA) structure
MA7 / MA25: aligned downwards, short-term decline continues
MA99: Slightly bullish sideways shift, current price near its lower end
That is:
Short-term: selling pressure remains
Medium-term: the structure is not completely broken, but momentum is weak
👉 It is important to maintain support at MA99 (approximately 2.34~2.35).
📐 Bollinger band view
Decline after several resistances at the upper band
Currently moving near the lower band
Band width is narrowing → decrease in volatility
👉 Consolidation/pullback zone before direction is determined.
📉 RSI analysis
RSI generally around 30
Close to oversold, but no clear rebound signal yet
Lower low trend continues
👉 The possibility of further decline is open, but there is also room for a technical rebound.
🔑 Major support / resistance zone
🟢 Support
2.34 ~ 2.35
Short-term main support
2.32
Decline could accelerate if it breaks below
🔴 Resistance
2.37 ~ 2.38
First resistance on short-term rebound
2.40
Decisive area for trend change
🧠 Strategy summary
✅ Conservative approach
After confirming support at 2.34~2.35
If volume decreases + candle stability shows, wait or limit entry
⚠️ Aggressive short
Rebound failure at 2.37~2.38
Target: 2.35 → 2.32
Stop loss: stability above 2.40
❌ Chasing long at current levels
Against the trend
Risk-reward not favorable
🔚 Conclusion in one line
XRP is testing lower support within a short-term decline.
And staying in the 2.34~2.35 area will determine the next rebound potential.
📌 Caution when investing
This chart analysis is for informational purposes only and does not guarantee any type of buying, selling, or profit. The cryptocurrency market is highly volatile, which can lead to investment losses. All investment decisions are the responsibility of the investor; use this material for reference only.