


📊 Summary of current situation
Current price: around 3,220
Previous high: around 3,250 ~ 3,255
Price movement summary:
Sharp bounce → formation of highs → ongoing short-term correction
Market condition:
Trend still remains, but balancing short-term overheating
👉 This is not the time to chase and buy, but to see where the correction ends.
📉 Moving average (MA) structure
MA7 / MA25: turning down after a sharp bounce
MA99: slowly moving upwards, current price is testing support near it
That is:
Short-term: profit taking and consolidation after a sharp bounce
Medium term: overall structure still remains in an uptrend
👉 Special attention is needed if going below or holding at MA99 (around 3,215~3,220).
📐 Bollinger band approach
Strong bounce touching the upper band
Return within the band after this → natural correction
Currently searching for direction around the midline
👉 Volatility is decreasing and preparing to choose the next direction.
📉 RSI analysis
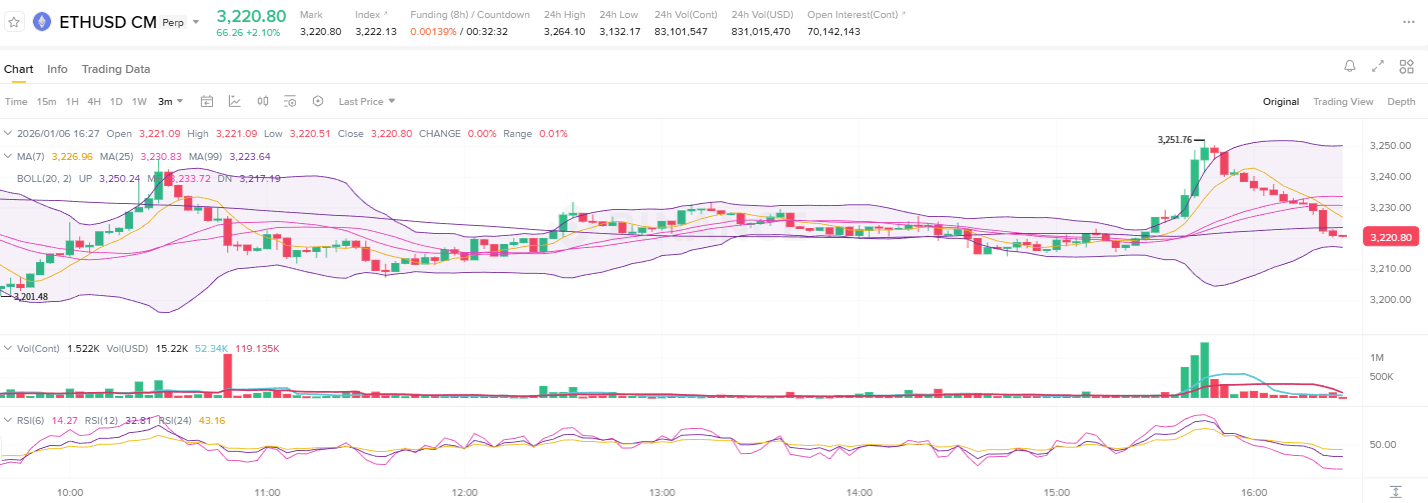
RSI dropped sharply after a strong bounce
Exiting overbought condition
Not currently oversold
👉 Slight possibility of additional decline remains,
But currently it is not a seller-dominated area.
🔑 Main support / resistance zone
🟢 Support zone
3,215 ~ 3,220
MA99 + short-term main support
3,200
If this level breaks, the short-term bullish scenario may weaken
🔴 Resistance zone
3,235 ~ 3,240
First resistance on a short-term rebound
3,250 ~ 3,255
Daily high, strong supply zone
🧠 Strategy summary
✅ Conservative long strategy
Entry after confirmation of support in the 3,215~3,220 area
Approach on volume decrease + candle stability
Target: 3,235 → 3,250
Stop loss: break below 3,200
⚠️ Aggressive long strategy
Confirmation of break and hold above 3,240
Target: retest the previous high
Quick response needed on failure
❌ Buying by chasing at the current price
Risk vs reward ratio is extremely unfavorable
Higher chance of getting stuck at highs
🔚 Conclusion in one line
Ethereum is in a healthy correction phase after a sharp bounce,
And support at 3,215~3,220 is the key point for determining the next direction.
Currently waiting is a more favorable strategy.
📌 Investment risk warning
This chart analysis is for informational purposes only and does not guarantee any type of buying, selling, or profit. The cryptocurrency market is highly volatile, which can lead to losses in investments. All investment decisions are the responsibility of the investor themselves, and this content should only be used as a reference.