



📊 Summary of current situation
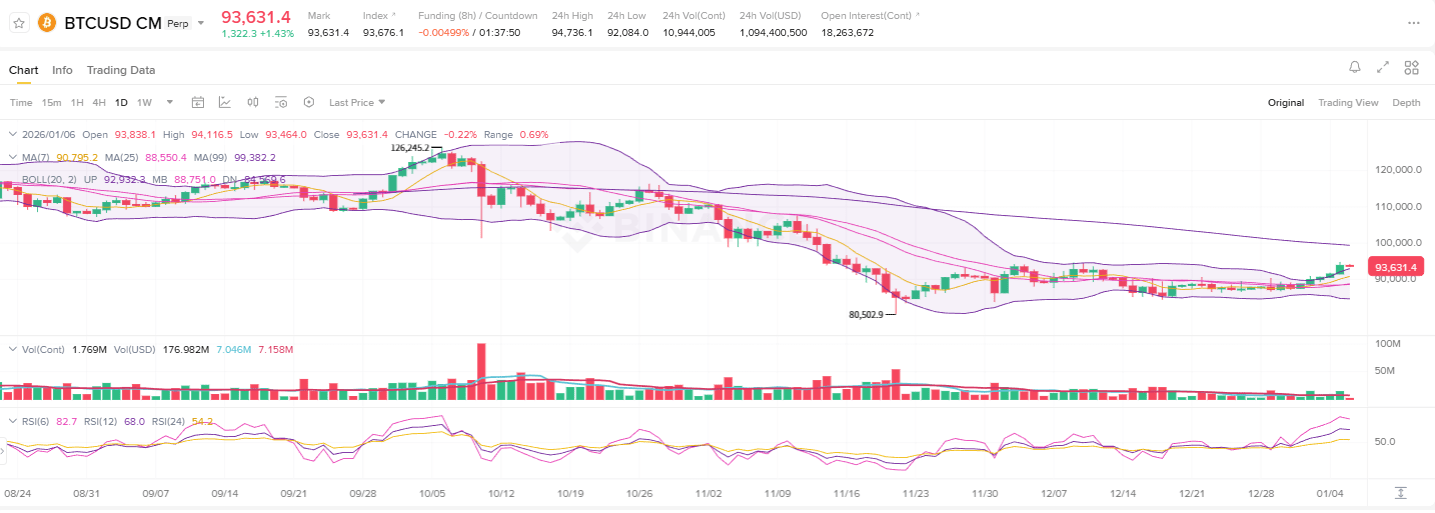
Current price: approximately 93,631
Medium-term trend: Decline after making higher highs → attempting to bounce back based on support
Long-term trend: Overall upward direction (uptrend) is still intact
Market condition: The downtrend has halted, and the market has entered a sideways + recovery phase.
👉 This phase is crucial to determine whether this is the beginning of a trend reversal or just a temporary bounce.
📉 Moving Average (MA) Structure
MA7 / MA25: Attempting to align upwards in the short term
MA99: Still positioned above the price and acting as medium-term resistance
That is:
Short-term: Bounce structure due to buying pressure
Medium term: No change in the full uptrend yet
👉 The breakout of MA99 (approximately 96K–98K) will be significant.
📐 Bollinger Bands Perspective
In the previous decline, the price broke the lower band strongly → a bounce followed
Currently, the price is recovering from the middle band towards the upper band
Band width is increasing again → indicates rising volatility
👉 The possibility of upward testing in the short term is open.
📉 RSI Analysis
RSI has risen above 50 again
Overbought condition is not present, but momentum is in favor of buyers
The RSI's lower level is higher compared to the previous lows → positive signal
👉 The short-term trend is shifting upwards from neutral after a decline.
🔑 Key support / resistance levels
🟢 Support Zone
92,000 ~ 92,500
First defense area in a short-term correction
90,000 ~ 90,500
If this level breaks, the possibility of a bounce may weaken
🔴 Resistance Zone
95,000 ~ 96,000
MA99 + previous rebound high
100,000
Psychologically and technically strong resistance
🧠 Strategy Summary
✅ Conservative Long Strategy
Phased entry after confirming support in the 92K area
Target: 95K → 98K
Stop Loss: Break below 90K
⚠️ Aggressive Long Strategy
If the price breaks and holds above 95–96K
Target: Retest of 100K
Quick response necessary if the break fails
❌ Buying by chasing at the current price
Risk/reward ratio is not favorable
Higher probability of loss on entry without correction
🔚 Brief Conclusion
On the daily chart, Bitcoin has halted the decline and entered a recovery phase, but has not yet fully crossed the medium-term downtrend.
📌 Investment Risk Warning
This analysis is presented for informational purposes only and does not constitute any form of investment advice. The cryptocurrency market is highly volatile and carries the risk of losses. All investment decisions are based on the investor's own responsibility.