



📊 Overview of the current movement
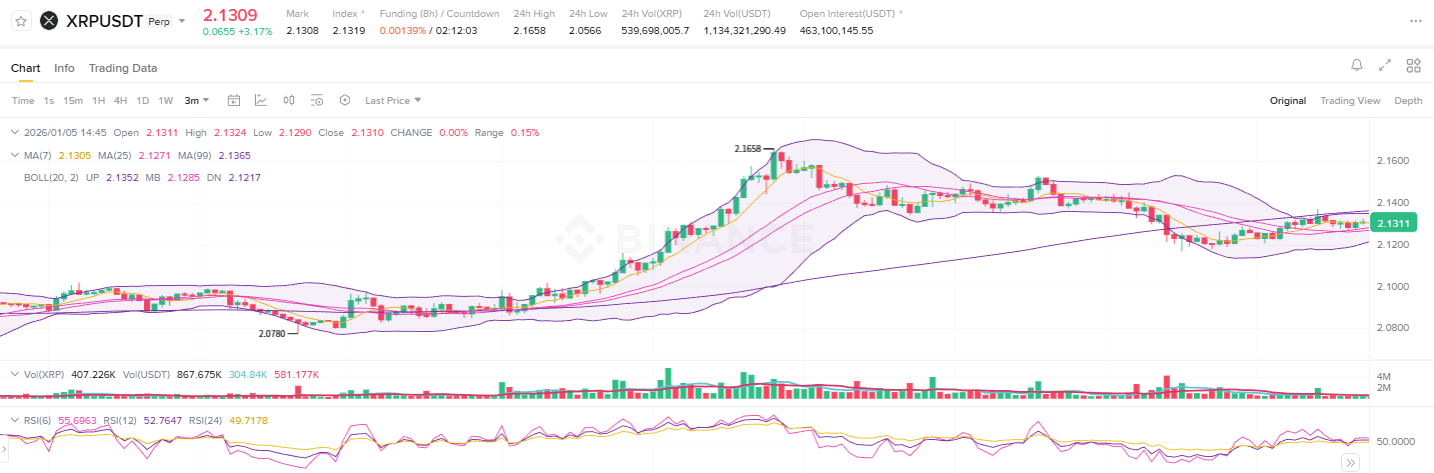
Current price: around US$ 2.13
Short-term top: approximately US$ 2.16
Recent bottom: around US$ 2.08
👉 After a strong rise, the price formed a top and is now following in
👉 slight correction with lateral consolidation.
👉 More than a trend reversal, the move indicates a pause to catch breath after the rise.
📉 Moving averages (MA) & Bollinger Bands
🔹 Moving averages
MA7 / MA25: crossing and moving sideways → lack of direction in the short term
MA99: continues in a positive slope, with the price staying above
📌 Interpretation
Short term: loss of momentum
Medium term: bullish structure preserved
Long term: trend still intact
🔹 Bollinger Bands
Upper band: around US$ 2.135 ~ 2.15
Center line: approximately US$ 2.128
Lower band: around US$ 2.12
👉 The bands are narrowing, indicating reduced volatility
👉 Typical pattern of compression zone before a directional move
🔑 Key supports and resistances
🟢 Important supports
US$ 2.12
Bollinger center line + short-term support
US$ 2.08
Recent bottom; loss may intensify the correction
US$ 2.05
Near MA99; loss weakens the medium-term structure
🔴 Important resistances
US$ 2.15
Immediate resistance
US$ 2.16 ~ 2.18
Previous top region
Break opens space for continuation of the rise
📦 Volume & RSI
🔹 Volume
Lower volume compared to the bullish phase
No signs of panic selling ❌
No aggressive buying ❌
👉 Predominance of caution and waiting for definition
🔹 RSI
RSI (14): around 50
Neither overbought nor oversold
👉 Phase of energy reacumulation
🧠 Possible scenarios
✅ Scenario 1: Consolidation followed by breakout upward (most likely)
Support at US$ 2.12 maintained
Volume entry
→ Break of US$ 2.16 → target at US$ 2.20 or above
⚠️ Scenario 2: Prolonged correction
Loss of US$ 2.12
→ Test of US$ 2.08 → US$ 2.05
Holding US$ 2.05, the medium-term trend remains valid
🎯 Conclusion in one sentence
XRP is not in a trend reversal, but rather in a
compression zone and balance between US$ 2.12 and US$ 2.16, waiting for directional definition.
⚠️ Important warning
This analysis is informative and does not constitute investment advice.
Every trade decision and its risks are the investor's own responsibility.
Always consider your profile and risk management before trading.