



Currently, this is a market point with characteristics of balance, more than a clear direction definition.
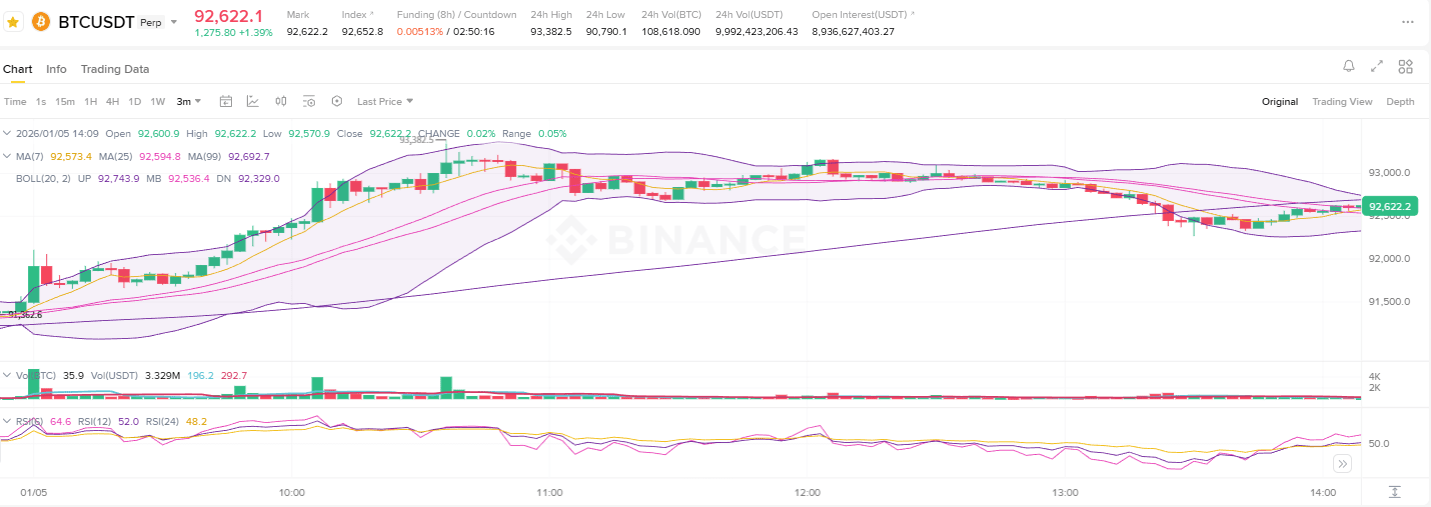
📊 Summary of the current movement
Current price: approximately US$ 92,620
Short-term high: US$ 93,300 ~ 93,400
Recent low: beginning of the US$ 92,000 range
👉 Strong rise → formation of a peak → gradual correction → sideways consolidation
👉 Instead of trend reversal, it is more reasonable to interpret it as an energy consumption phase after the high.
📉 Moving Averages (MA) & Bollinger Bands
Moving averages
MA7 / MA25: slightly tilted sideways or slightly downwards
MA99: continues in an uptrend, with the price still above it
📌 Interpretation
Short term: loss of strength
Medium term: bullish structure maintained
Bollinger Bands
Upper band: ~ US$ 92,740
Central band: ~ US$ 92,360
Lower band: ~ US$ 92,230
👉 The bands are narrowing, indicating reduced volatility
👉 Compression zone before a possible directional breakout
🔑 Key support and resistance levels
🟢 Important supports
US$ 92,300
– Central Bollinger Band + short-term support
US$ 92,000
– Psychological support + previous low
US$ 91,700
– Region close to MA99; losing this level weakens the structure
🔴 Important resistances
US$ 92,800 ~ 92,900
– Short-term upper resistance
US$ 93,300
– Previous high
– Breakout indicates resumption of the uptrend
📦 Volume & RSI
Volume
– Significant drop compared to the uptrend period
– No panic selling ❌
– No aggressive buying ❌
👉 Predominance of a wait-and-see posture
RSI
RSI(14) around 45 ~ 50
– Neither overbought nor oversold
👉 Energy reaccumulation zone before direction definition
🧠 Possible scenarios
✅ Scenario 1: Consolidation followed by a breakout upwards (most likely)
– Support at US$ 92,300 maintained
– Breakout with increased volume
– New test of US$ 93,300 → above this, target in the region of US$ 94,000
⚠️ Scenario 2: Extension of the correction
– Loss of US$ 92,000
– Tests at US$ 91,700 → US$ 91,500
– Maintaining this range, the medium-term bullish structure remains valid
🎯 Conclusion in one sentence
At this moment, instead of impulsively entering buys or sells,
the ideal is to wait for direction definition within the range between US$ 92,000 and US$ 93,300, which characterizes a clear compression zone.
⚠️ Important warning
This analysis is exclusively informative and does not constitute investment recommendation.
All decisions and responsibilities related to investments are the investor's own.
Before trading, always consider your risk profile and capital management strategies.