



📊 Current Condition Summary
Current price: around 87.230
Short-term movement: after a sharp decline, a technical rebound is occurring
Medium-term direction: downward trend pressure is still dominant
Volatility: sharply increased in the lower area, then started to ease
👉 Currently, it is more appropriate to consider it as a rebound phase, not a trend reversal.
📉 Moving Average Structure (Important)
MA7 / MA25: after a sharp decline, forming a golden cross pattern and triggering a price bounce
MA99 (purple): still showing a strong downward slope
👉 Structurally:
short-term rebound colliding with medium-term downward trend
Meaning:
The current increase is more of a short covering + technical rebound
Not enough evidence that the trend has reversed upwards
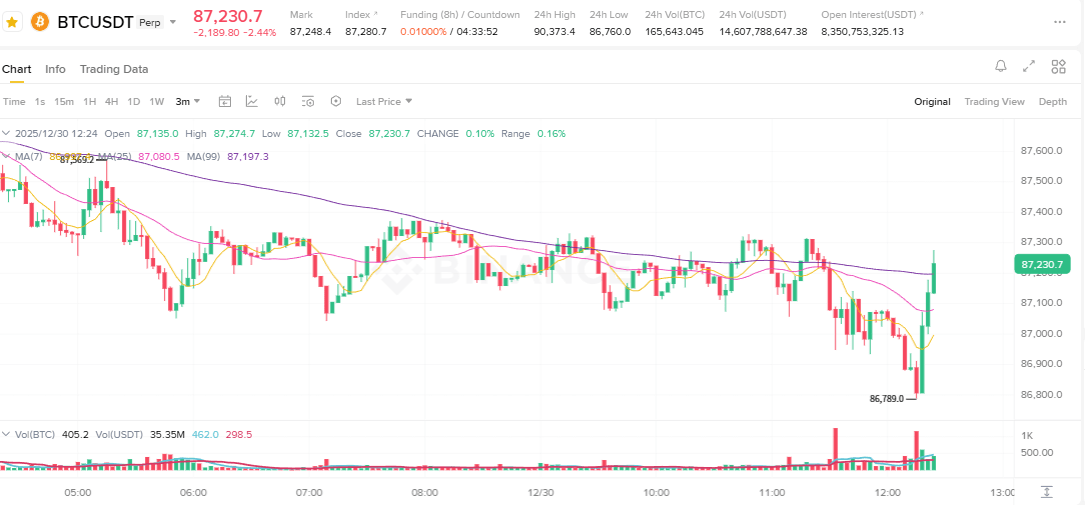
🔻 Price Movement Analysis
87.800 → 86.780
Sharp decline in a short time
Large volume appears in the lower area
Formation of support at 86.780
Long lower wick, indicating selling pressure is starting to run out
Current condition
Strong rebound from the lowest point
However, the price is already approaching the previous lower consolidation area (around 87.300)
👉 This area is a retracement resistance.
🔑 Key Support & Resistance Area
🟢 Support
86.780 ~ 86.900
Lowest point of the day
If broken again, potential continuation of the downward trend
87.000
Short-term psychological support
🔴 Resistance
87.300 ~ 87.400
Previous lower consolidation area
The most important resistance currently
87.600 ~ 87.800
MA99 area and previous peak
As long as it is not broken, the medium-term downward trend remains valid
📉 Volume Analysis
Volume sharply increases in the bottom area
Volume decreases as prices rebound
👉 Meaning:
Selling pressure has decreased
However, aggressive buying pressure has not yet been seen
= waiting phase for direction confirmation
🧠 Recommended Trading Strategy
✅ Long Scenario (Conservative)
Wait for support confirmation at 86.900 ~ 87.000
Suitable for scalp or taking short bounces
Target: 87.300 ~ 87.400
Stop loss: below 86.780
⚠️ Short Scenario (More Profitable)
If the price fails to break 87.300 ~ 87.400
Short in the peak rebound area
Target: 87.000 → 86.800
Stop loss: if the price holds above 87.500
❌ Do not chase Long at current prices
Risk/reward ratio is less attractive
Risk of being trapped at a short-term peak
🔚 Brief Conclusion
BTC is experiencing a technical rebound after a sharp decline,
but has not yet exited the medium-term downward trend.
The area 87.300~87.400 will determine the next movement direction.